News · 17-10-2026 · How each neighbourhood changes and what every click says
17 October 2026. How each neighbourhood has changed since 2009, where people live dot by dot, the air of every street from 2018 to 2024, Bicing on a typical weekday and the elections by census section. On the right, the card answers with charts and offers first the action that fits what you are doing. Real screenshots of the test viewer (interface in Catalan, light theme).
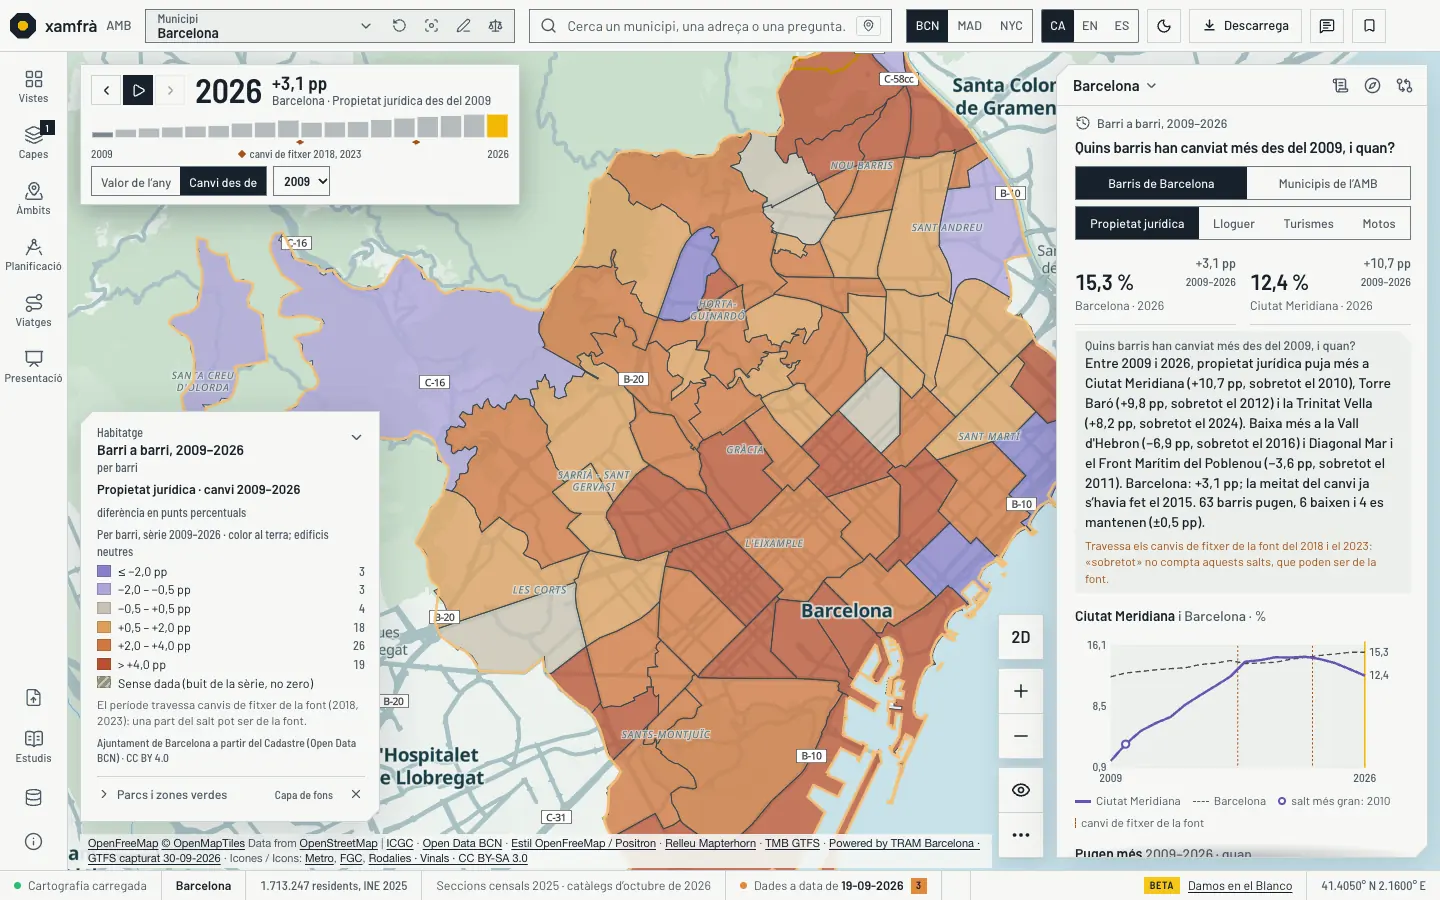
How each Barcelona neighbourhood has changed, and when: ownership by legal entities (2009–2026), rent of new contracts (2014–2025) and cars and motorbikes per 1,000 inhabitants (2019–2025); for the AMB, rent and vehicles by municipality. One indicator at a time, on the ground with its outline, as «Value of the year» or «Change since», with ▶ to step through the years. In Barcelona, legal-entity ownership goes from 12.3 % to 15.3 % (+3.1 pp); the largest jump is in Ciutat Meridiana (+10.7 pp, in 2010). Gaps are hatched, not zero, and the legend warns when the period crosses a change of source file (2018, 2023). It does not state a cause.
Barcelona City Council: cadastral owners and vehicle fleet by neighbourhood (Open Data BCN, CC BY 4.0); Generalitat de Catalunya: Incasòl rental deposits; Idescat: vehicle fleet (from the DGT) and population register. Base map: OpenFreeMap, © OpenMapTiles, OpenStreetMap contributors data (ODbL); terrain Mapterhorn.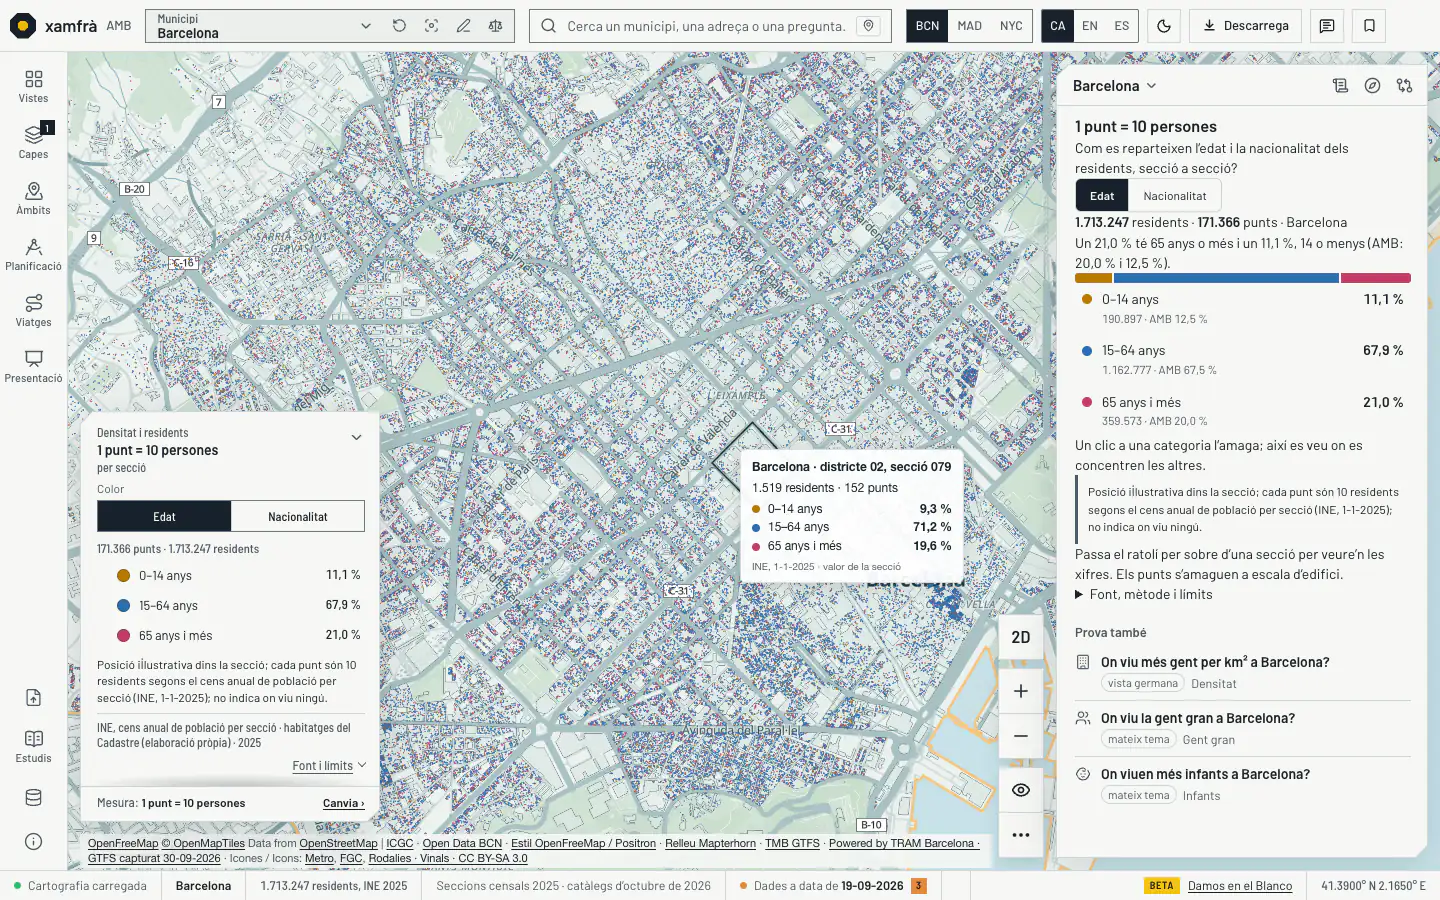
A dot map of AMB residents by age or by nationality: each census section draws its residents divided by 10, shared among the parcels with dwellings in proportion to the dwellings and placed at random inside the footprint. 345,066 dots in all. Age and nationality are never crossed, and the dots hide at building scale: a dot does not show where anyone lives.
Residents by census section: INE, 1-1-2025. Dwellings per parcel: Cadastre (INSPIRE). Allocation estimate, not real locations. Base map: OpenFreeMap, © OpenMapTiles, OpenStreetMap contributors data (ODbL); terrain Mapterhorn.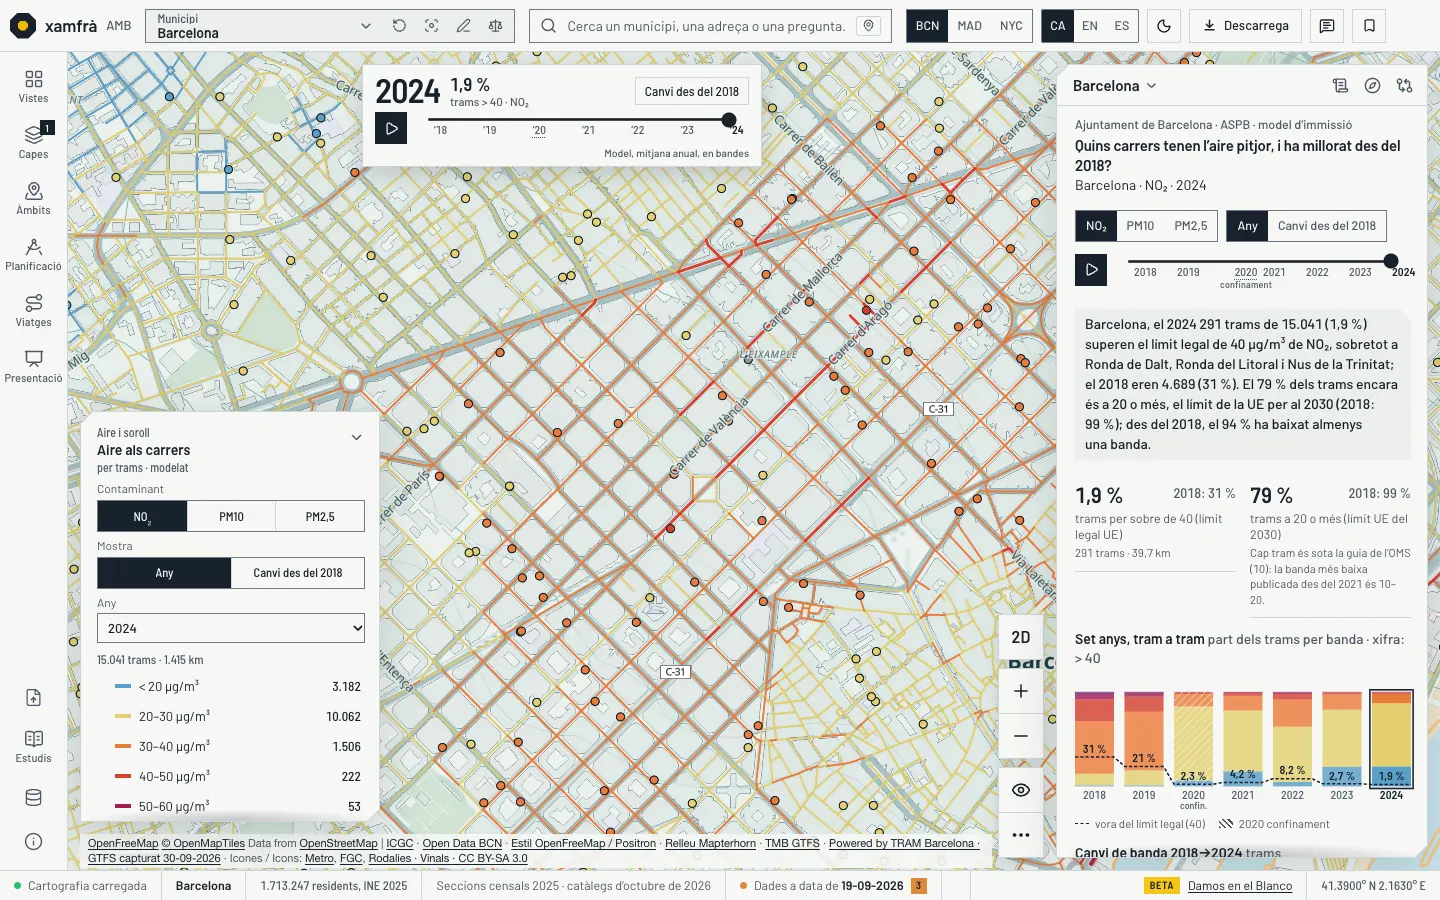
NO₂, PM10 and PM2.5 for every street section in Barcelona, year by year from 2018 to 2024, with ▶ and a change-since-2018 mode: 15,041 sections with the same geometry every year. In 2024, 291 sections (1.9 %) exceed 40 µg/m³ of NO₂; in 2018 there were 4,689 (31 %). Schools are read from the section in front of them (≤ 30 m): those at 40 or more for NO₂ go from 247 in 2018 to 3 in 2024. It is the annual mean of a model, not a street measurement; 2020 is the lockdown year.
Immission maps by Barcelona City Council and the Barcelona Public Health Agency (Open Data BCN, CC BY 4.0). Barcelona only. Base map: OpenFreeMap, © OpenMapTiles, OpenStreetMap contributors data (ODbL); terrain Mapterhorn.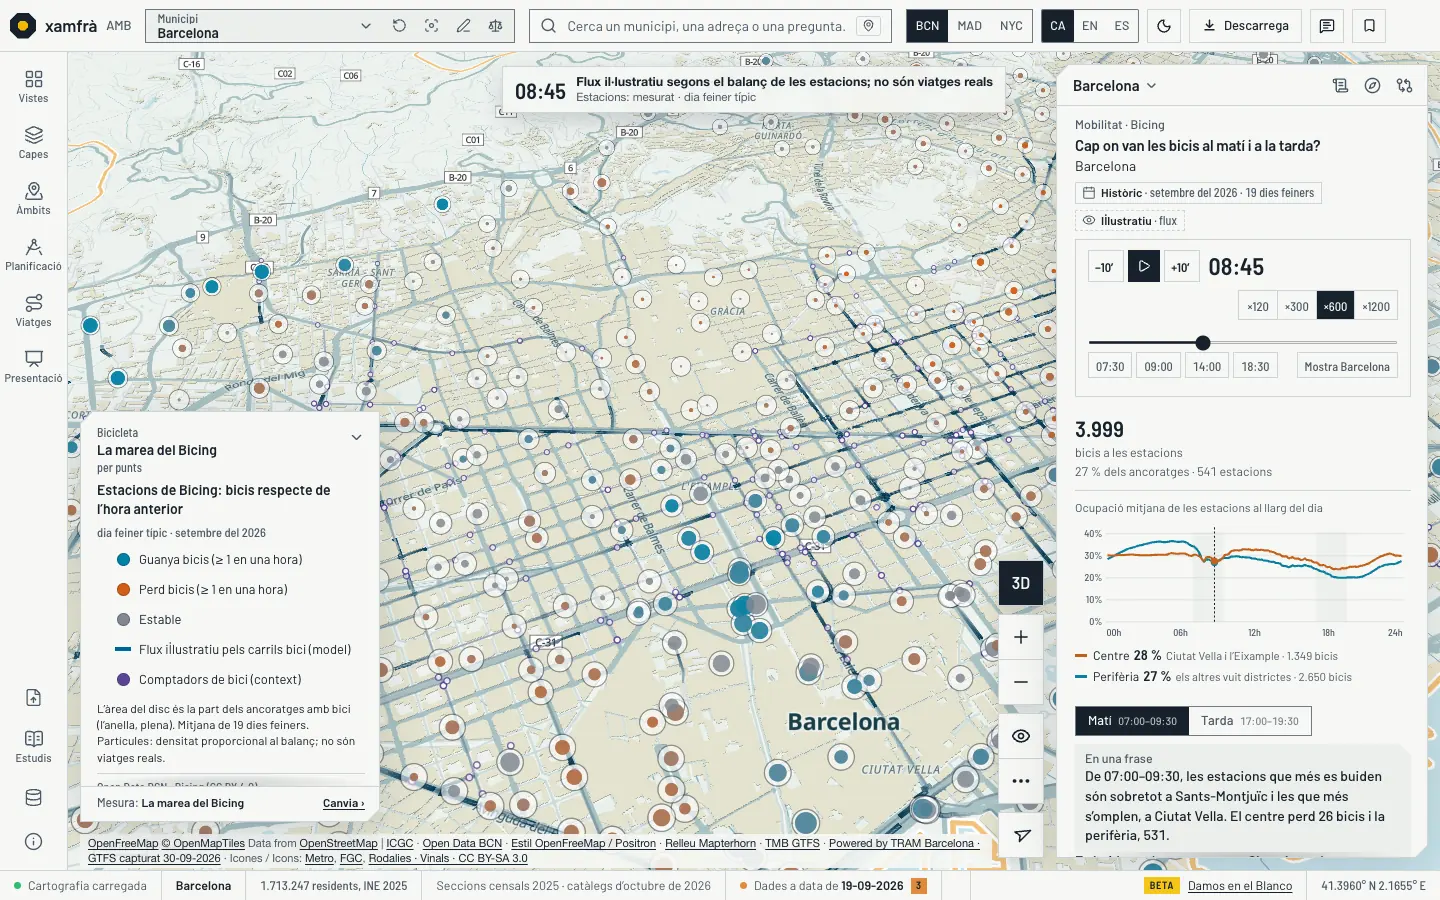
A typical weekday at Bicing’s 541 stations, every 10 minutes: the mean of 19 weekdays of September 2026, holidays excluded. The disc is occupancy and the colour shows whether the station gains or loses bikes against the previous hour. The panel has a clock with ▶, the curve for the centre and the outskirts, and which stations empty and fill most in the morning and the afternoon. The particles along the cycle lanes are an illustrative flow in the direction of the balance, not real trips, and they always say so.
Bicing station status and information: Open Data BCN (CC BY 4.0), measured. Flow along the lanes: illustrative. Base map: OpenFreeMap, © OpenMapTiles, OpenStreetMap contributors data (ODbL); terrain Mapterhorn.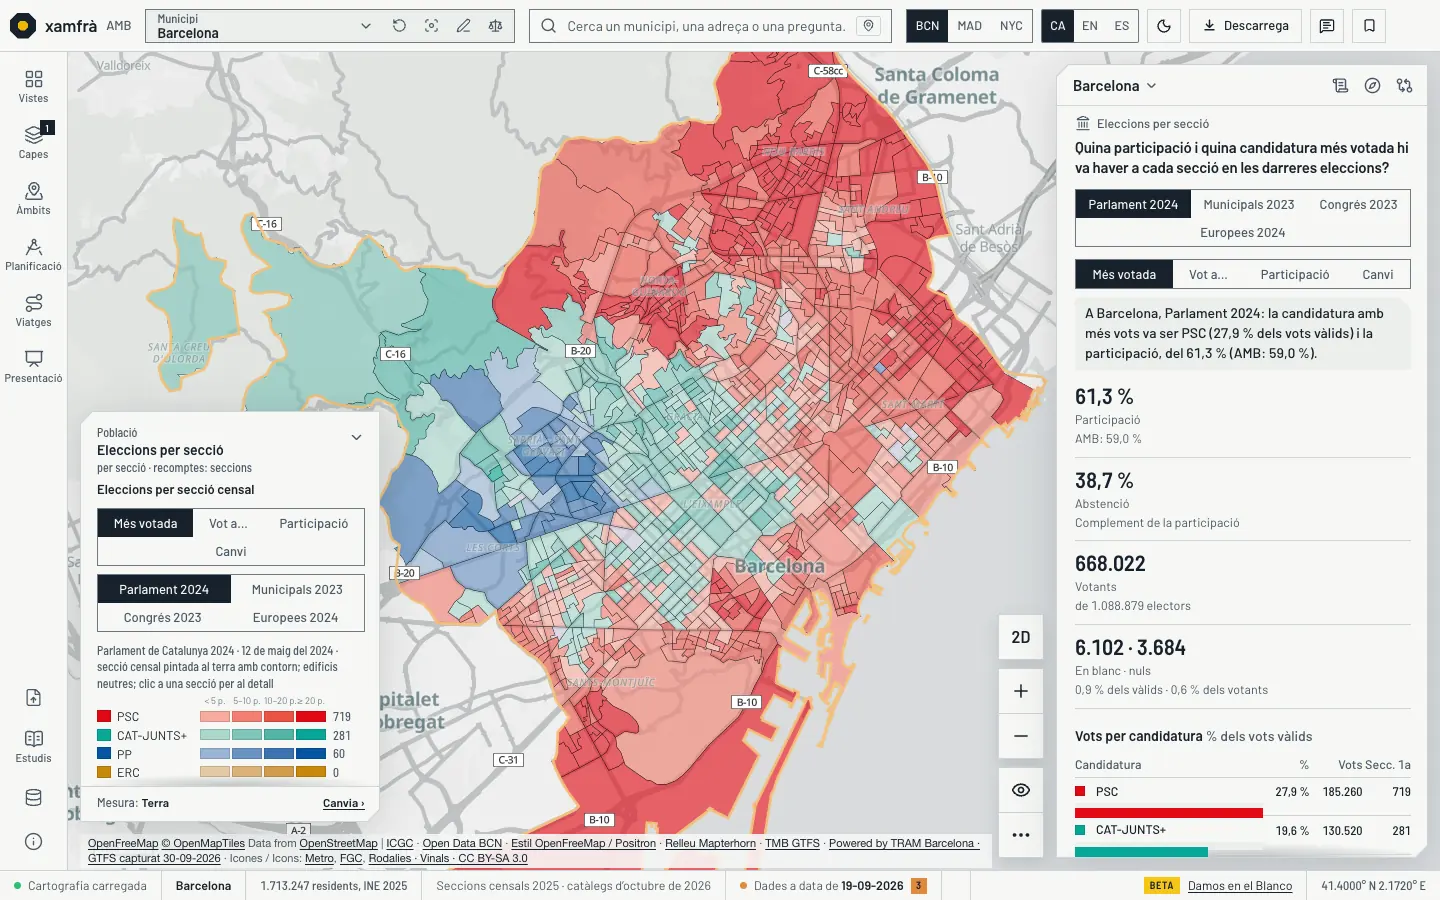
Four ways to look at the results by census section: the leading list, with the strength of its margin over the second; the vote for one list; turnout; and change. Change is only computed between comparable elections (Congress 2023 → Parliament 2024, same register); sections that cannot be compared are hatched. In the AMB, the leading list changes in 381 of 2,119 sections and turnout goes from 66.9 % to 59.2 %. Official party colours, no interpretive text.
Generalitat de Catalunya: election results by section (Electoral processes, Open Data Catalonia). Base map: OpenFreeMap, © OpenMapTiles, OpenStreetMap contributors data (ODbL); terrain Mapterhorn.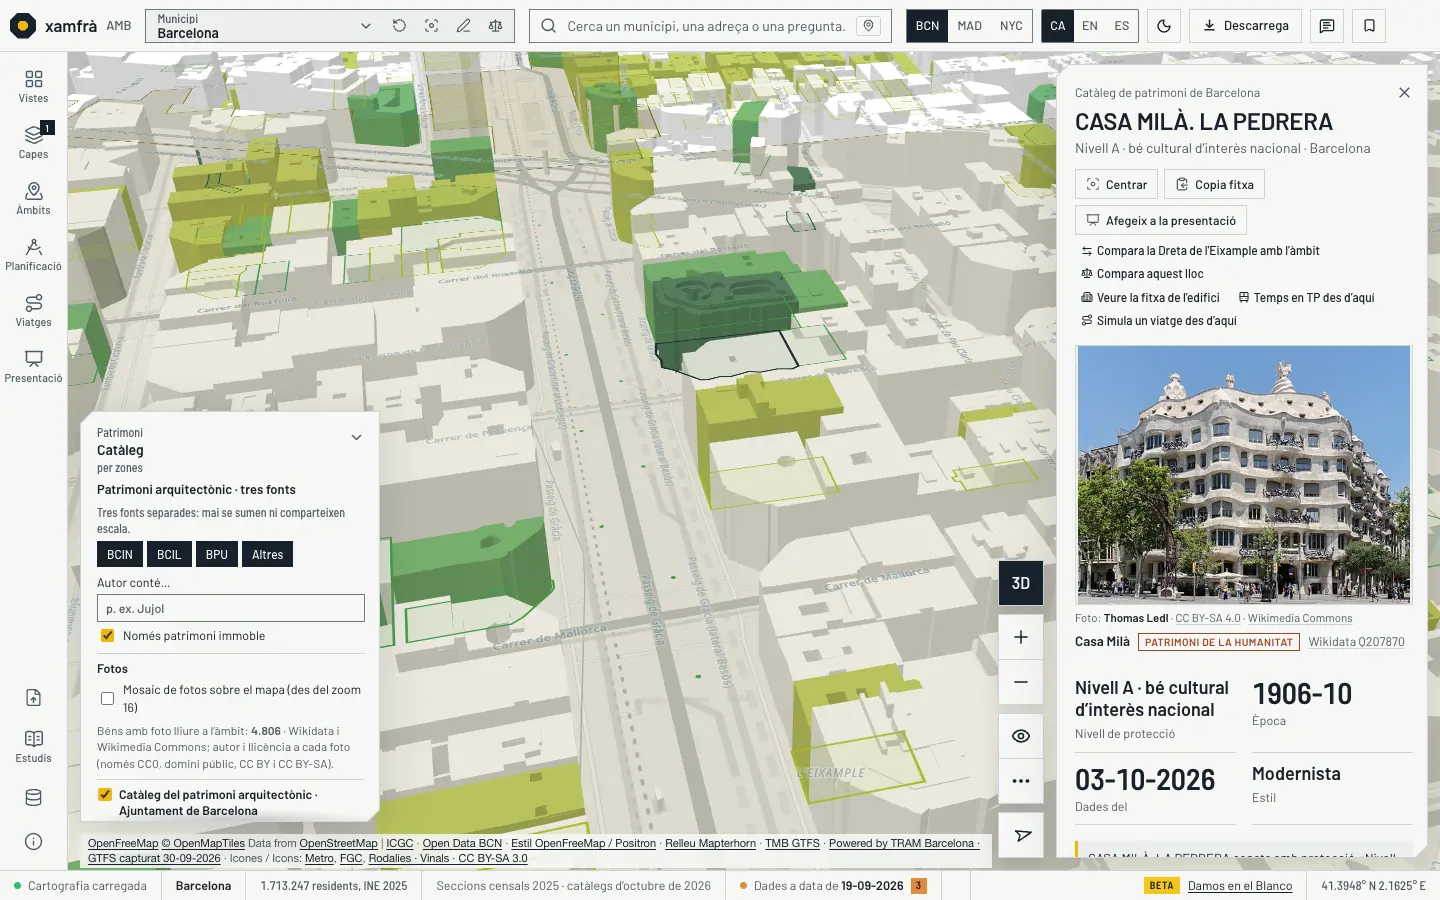
The card of a protected building now carries a free photo from Wikimedia Commons, with the author and the licence underneath and a link to the original. 6,502 heritage items have a photo across the 36 municipalities; photos without a free licence or without an author are not used, and a missing photo leaves no gap. From zoom 16, an optional mosaic shows the photos on the map without overlaps.
Photos: Wikimedia Commons (CC BY-SA, CC BY, CC0 or public domain, per photo); items: Wikidata, the Diputació de Barcelona’s Cultural Heritage Maps and the AMB and Barcelona catalogues. Base map: OpenFreeMap, © OpenMapTiles, OpenStreetMap contributors data (ODbL); terrain Mapterhorn.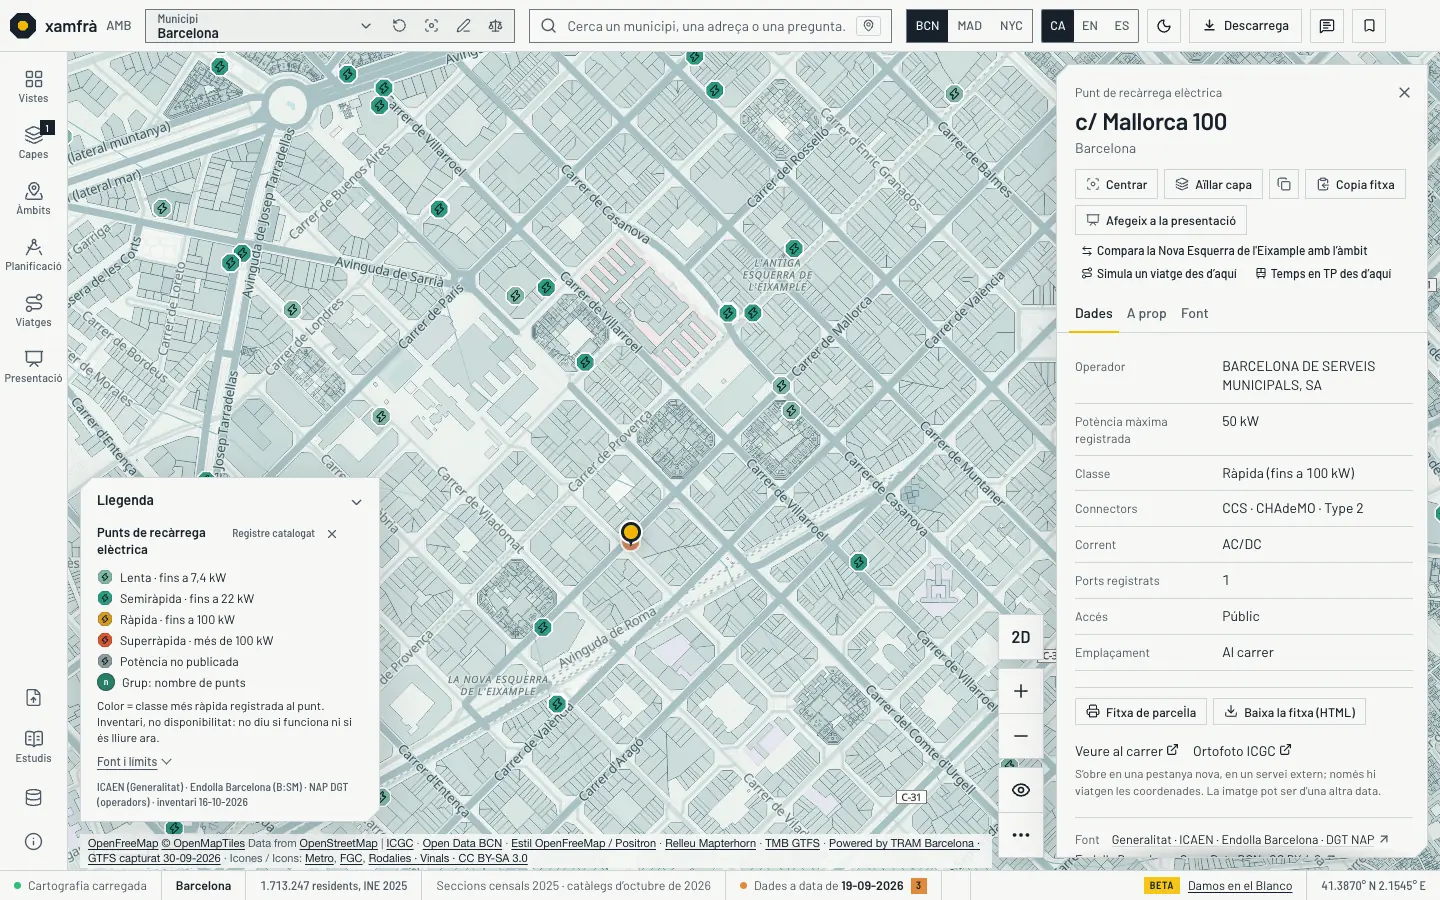
The charging-point inventory adds a third source, the DGT’s national access point (NAP), declared by the operators: there are now 1,228 sites in the AMB (842 before), each with its operator, charging points and connectors. The «Electrification» study is rebuilt on this inventory and counts charging points, not sites: 3,785 points, with their power added up, and 235 priority sections where 368,541 residents live.
DGT NAP (DATEX II, MITERD; free licence), ICAEN and Endolla Barcelona. Study: own method. Base map: OpenFreeMap, © OpenMapTiles, OpenStreetMap contributors data (ODbL); terrain Mapterhorn.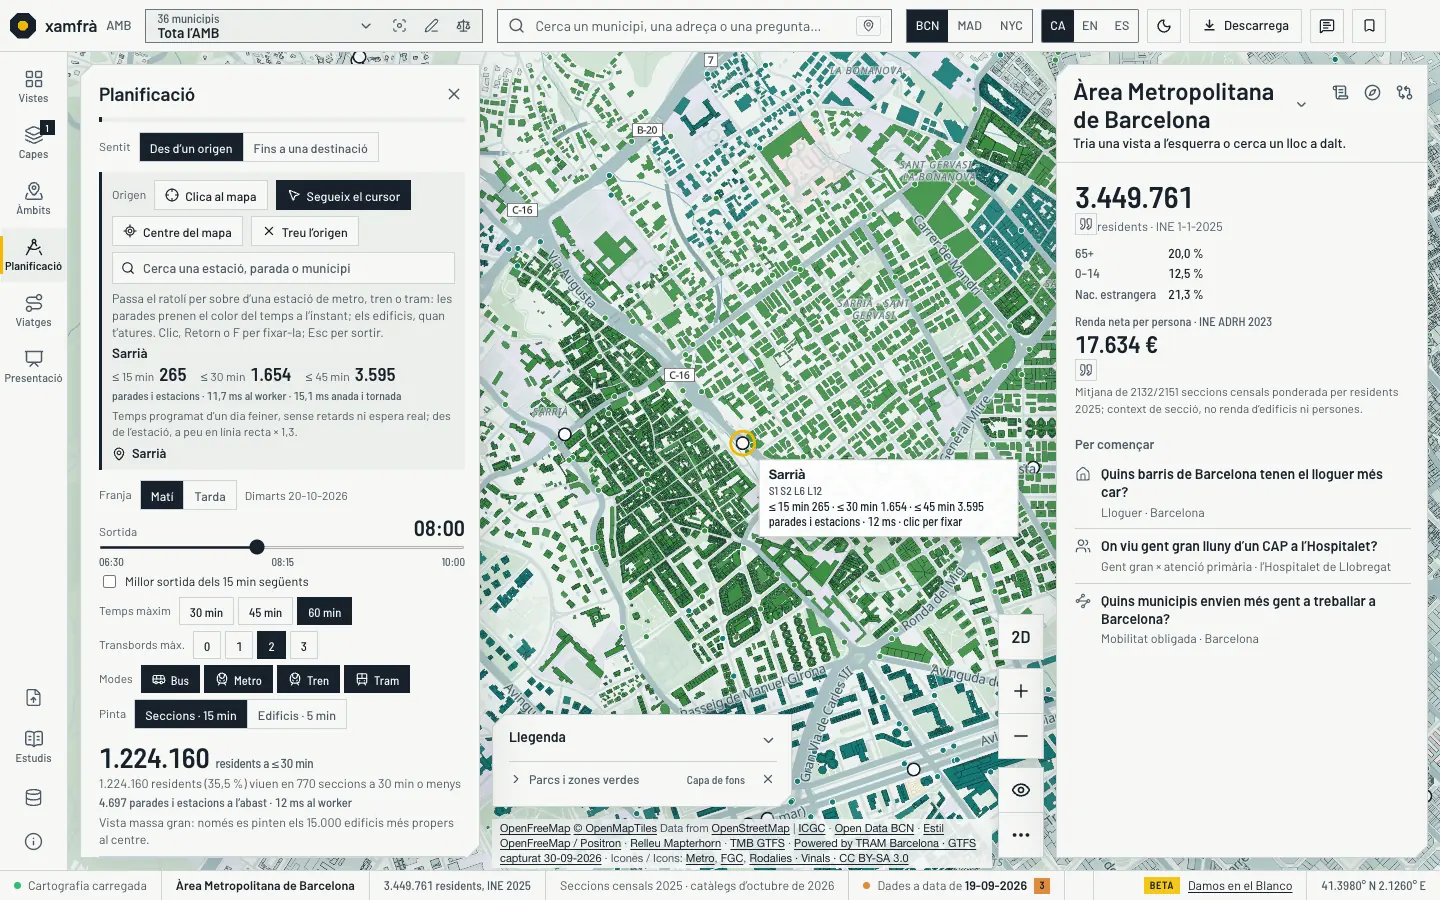
«Time by PT» has a «Follow the cursor» mode: move the mouse over a metro, train or tram station and the stops are painted at once by the minutes it takes to reach them; slide along a line and the isochrone moves with you. When you stop, the station becomes the origin and the buildings are painted; a click fixes it. The figure of residents within 30 minutes also says how many sections it counts. It is the scheduled time of a weekday, without delays.
GTFS timetables of AMB, TMB, FGC, Renfe Rodalies and TRAM (scheduled, not real times); walking legs as the crow flies. Base map: OpenFreeMap, © OpenMapTiles, OpenStreetMap contributors data (ODbL); terrain Mapterhorn.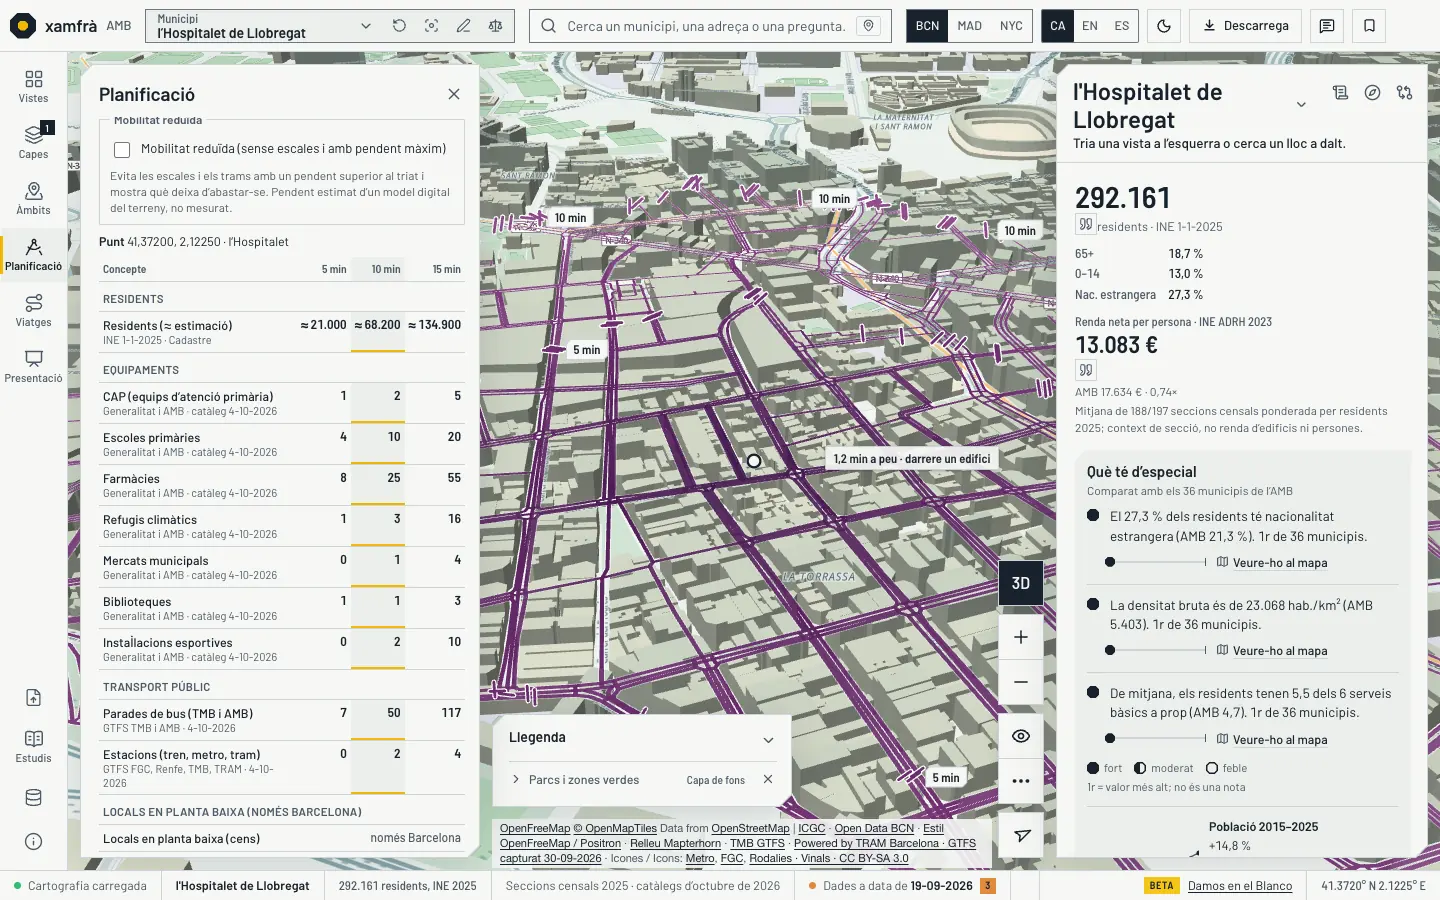
The walking reach, routes, a station’s catchment and section outlines can now be seen through the buildings: the hidden part is drawn faded and the visible part in full. The front is animated with the seconds of the calculation (still if you ask for less motion) and, when you hover a segment, it gives its walking minutes, and «behind a building» if a volume hides it.
Pedestrian street network: OpenStreetMap (ODbL). Base map: OpenFreeMap, © OpenMapTiles, OpenStreetMap contributors data (ODbL); terrain Mapterhorn.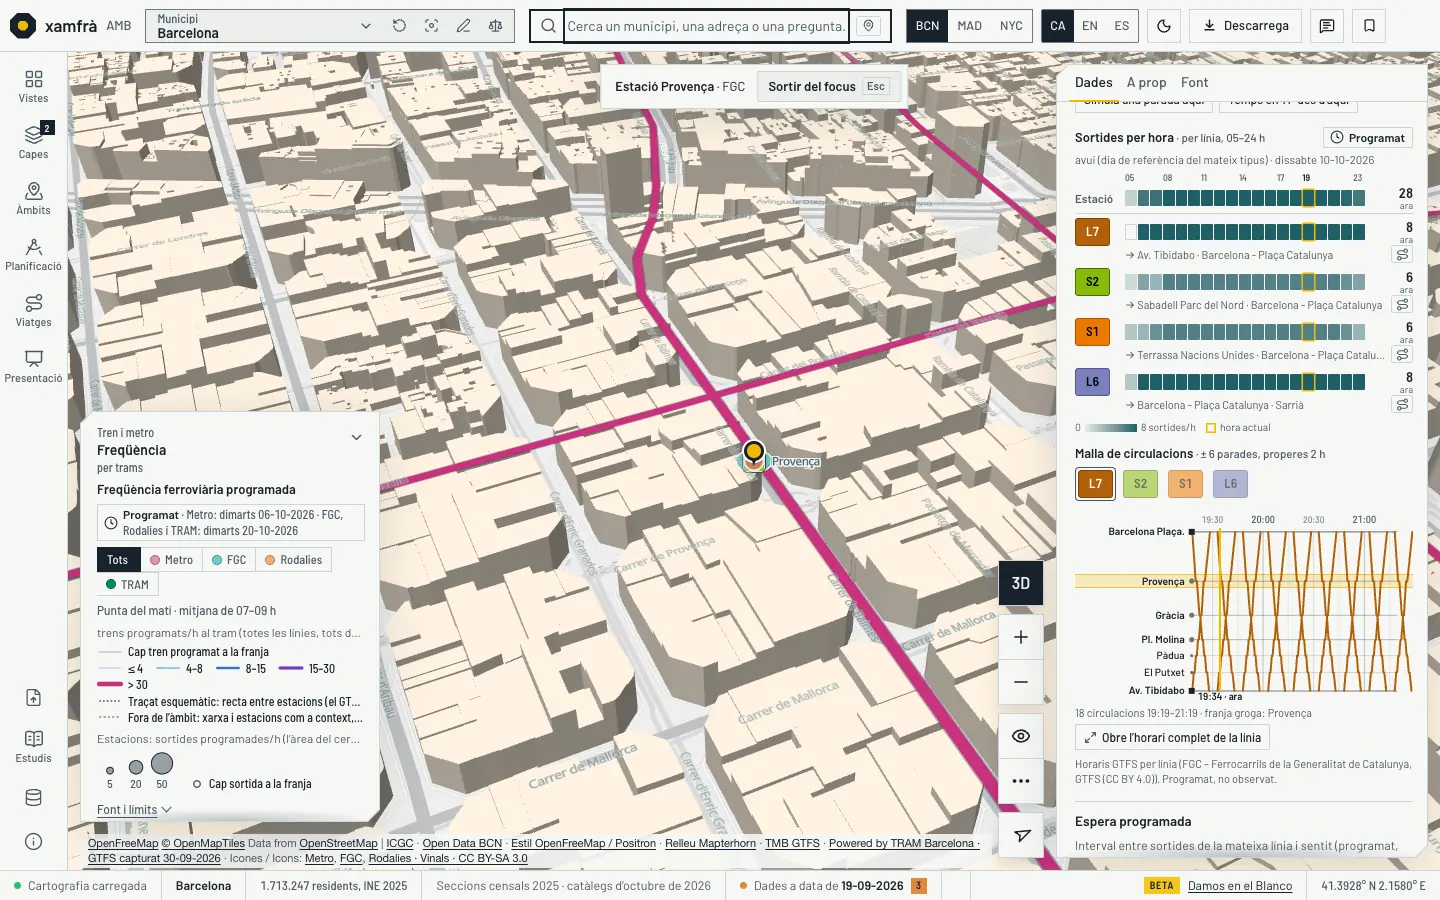
A stop or station card shows the departures per hour of each line, from 5 am to midnight, with the current hour marked, and a train graph: six stops on each side and the next two hours, with the stop highlighted. They are exact counts from the timetables; where the source only publishes frequencies it says «≈», and what is not published is hatched, never set to zero.
GTFS timetables of AMB, TMB, FGC, Renfe Rodalies and TRAM (scheduled). Base map: OpenFreeMap, © OpenMapTiles, OpenStreetMap contributors data (ODbL); terrain Mapterhorn.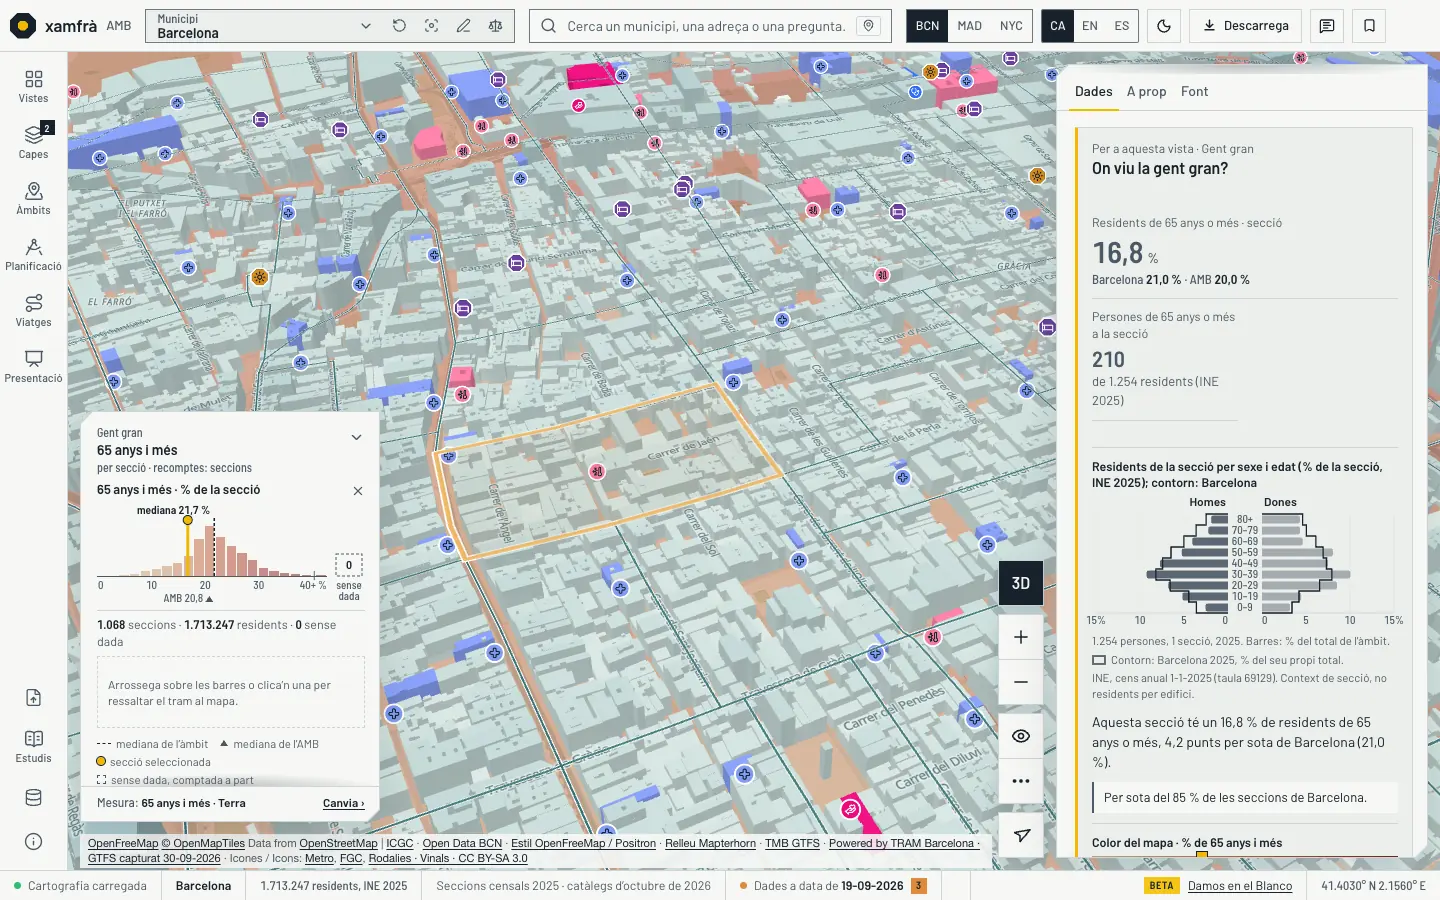
When you click a building or a section, the card on the right shows, right after the key figures, the chart that answers the view’s question: the section’s age pyramid with the municipality’s outline, housing tenure, use and age of the parcels, active premises. Series carry the AMB or Barcelona reference on the same scale, the position among the 36 municipalities with the median and, in change views, before and after with the source values. Unknown is never zero.
Each chart carries its own source and period; in the screenshot, residents by age of the section: INE, 1-1-2025. Base map: OpenFreeMap, © OpenMapTiles, OpenStreetMap contributors data (ODbL); terrain Mapterhorn.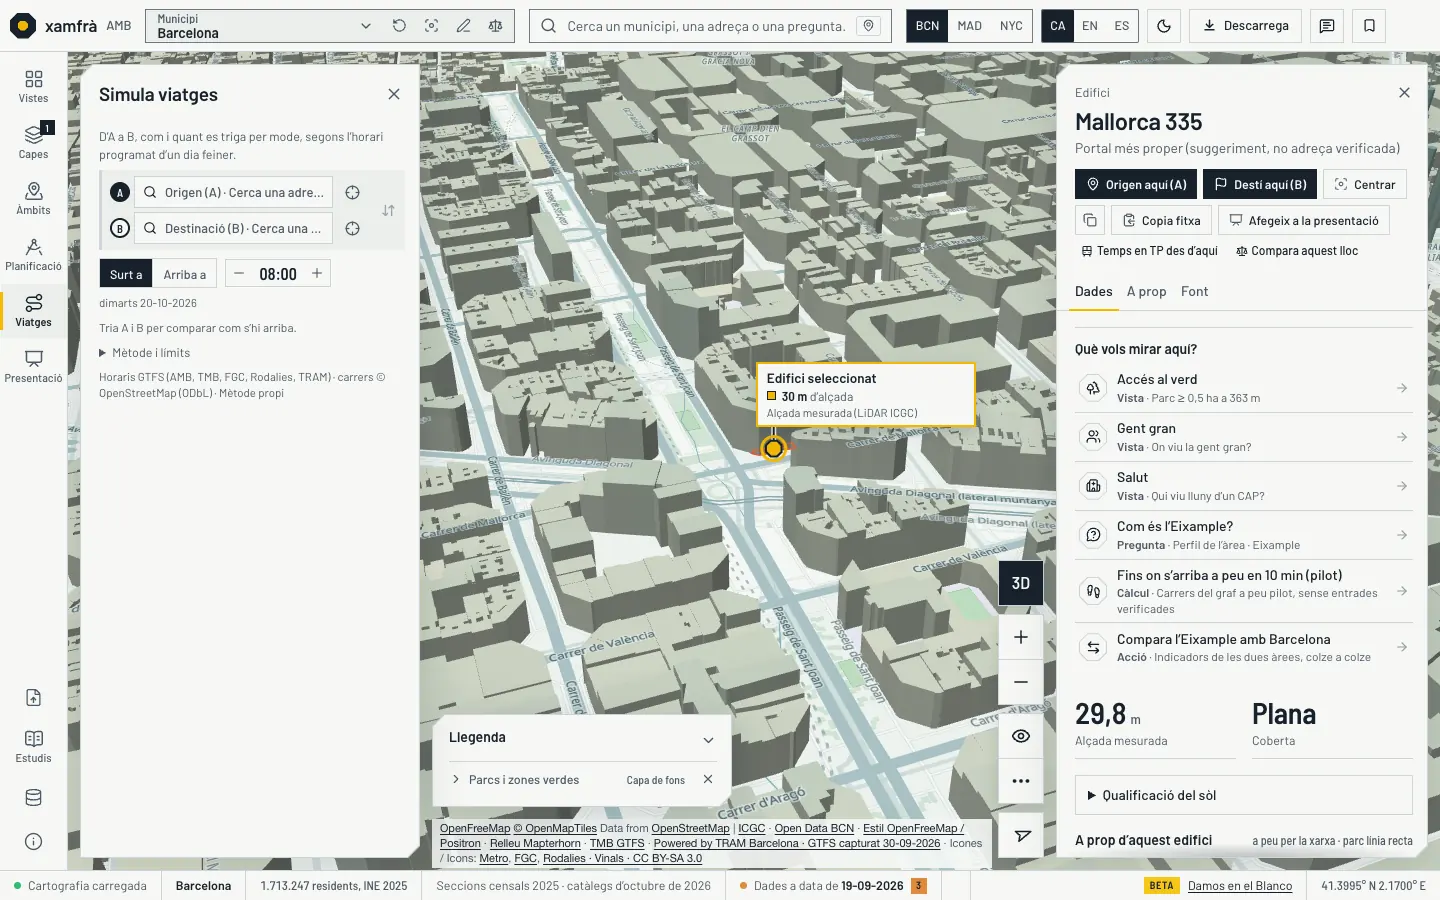
Building, stop, facility, street and zoning cards order their actions by what you have open. With «Simulate trips», the first one is «Origin here (A)» or «Destination here (B)»; with a planning tool, «Use this building» for that tool; with «Compare sites», «Add to the comparison». The stop card follows the view’s time band instead of a fixed morning peak.
Base map: OpenFreeMap, © OpenMapTiles, OpenStreetMap contributors data (ODbL); terrain Mapterhorn.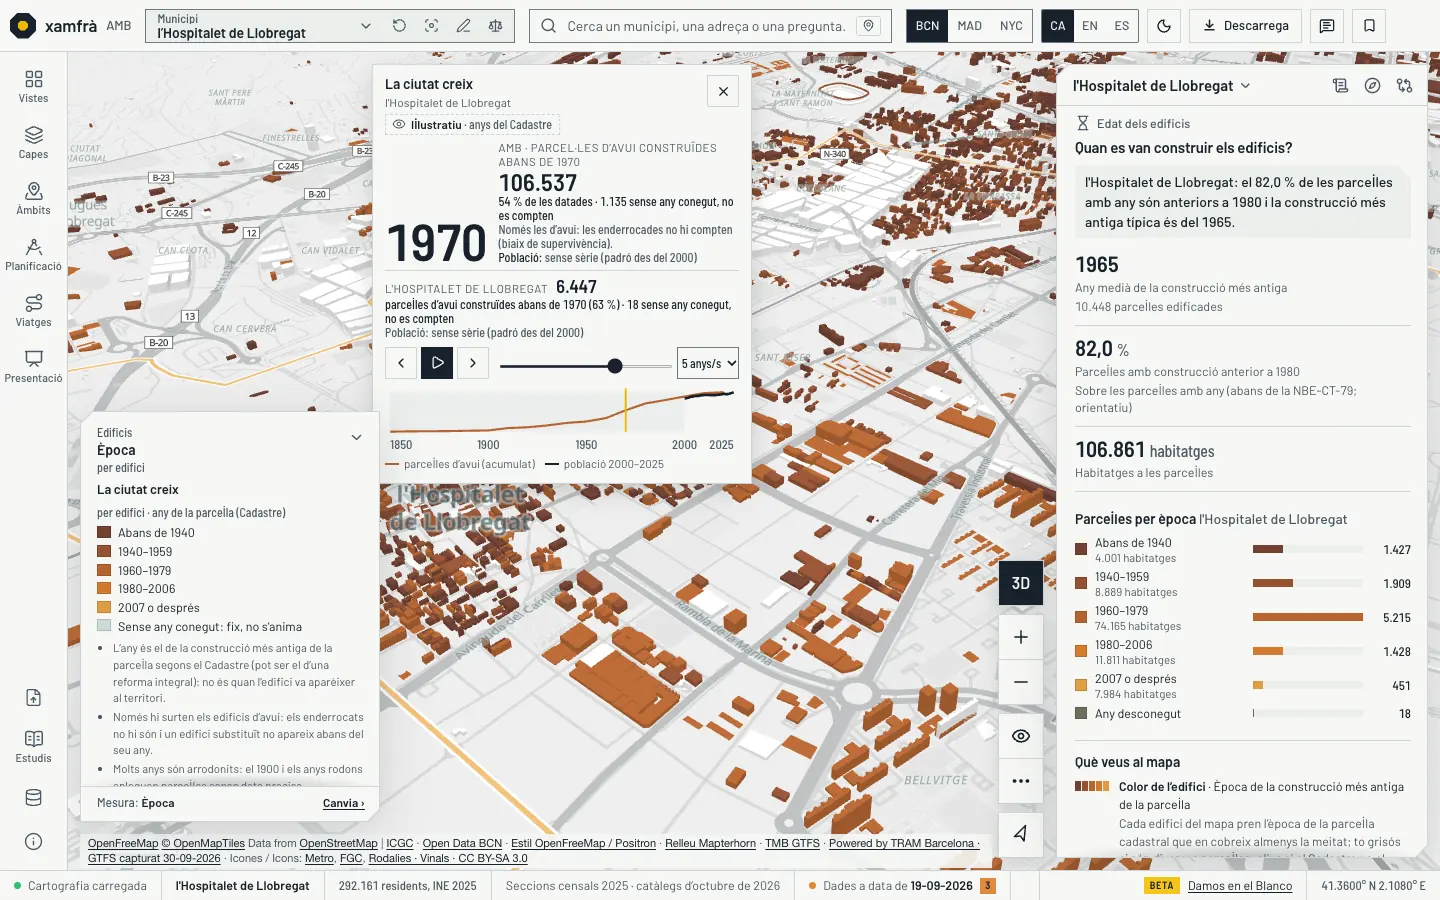
Time tools carry a counter that moves with the clock: today’s parcels built before each decade in «The city grows» (with the 1,135 without a year shown apart), riders of the month and the year’s running total in «The network that stopped», accumulated accidents in the «Accident clock», MITMA trips between zones and the scheduled vehicles of «Network in motion». It only rolls between two real values; unknown is not zero, and with reduced motion it shows the final value.
Base map: OpenFreeMap, © OpenMapTiles, OpenStreetMap contributors data (ODbL); terrain Mapterhorn.New: 60-second stories
17 October 2026. Three one-minute tours that chain views of the viewer with the camera and two lines of text per step. They play on their own, pause when you touch the map and can be followed step by step. Every figure comes from the published data. Real captures of the viewer in testing.

The ICGC orthophoto curtain (29 flights from 1945 to 2025) over the Zona Franca and the Olympic Village, the city rising year by year from the Cadastre, today’s building licences and the population register from 2000 to 2025. Play it →
Orthophotos: Institut Cartogràfic i Geològic de Catalunya (CC BY 4.0).
From morning to night: estimated home-to-work trips (MITMA), the whole scheduled network moving at 08:40, the Subsòl, the way home and the accident clock. Play it →
GTFS timetables of AMB, TMB, FGC, Renfe Rodalies and TRAM (scheduled, not real positions); MITMA, Estudios de movilidad con Big Data.
The demand public transport does not resolve, the minutes’ walk to a park, the surface heat measured by satellite, climate shelters and older people far from a CAP. Play it →
Parks and street network: OpenStreetMap (ODbL); MITMA; Landsat (USGS); AMB and Barcelona shelters; CatSalut.News · 16-10-2026 · Time, history and what moves
16 October 2026. Tools for looking at time: the city rising since 1850, the orthophotos since 1945, the whole scheduled transport network in motion, MITMA trips band by band, the «Accident clock» and the network that stopped in 2020. Also the day’s cruise ships, sun and shadow at any hour, where public transport does not reach, «Simulate trips» by bike and by car, urban logistics and public safety. Every tool says whether it shows what was observed, what is scheduled or what is a model. Real screenshots of the test viewer (interface in Catalan, light theme).
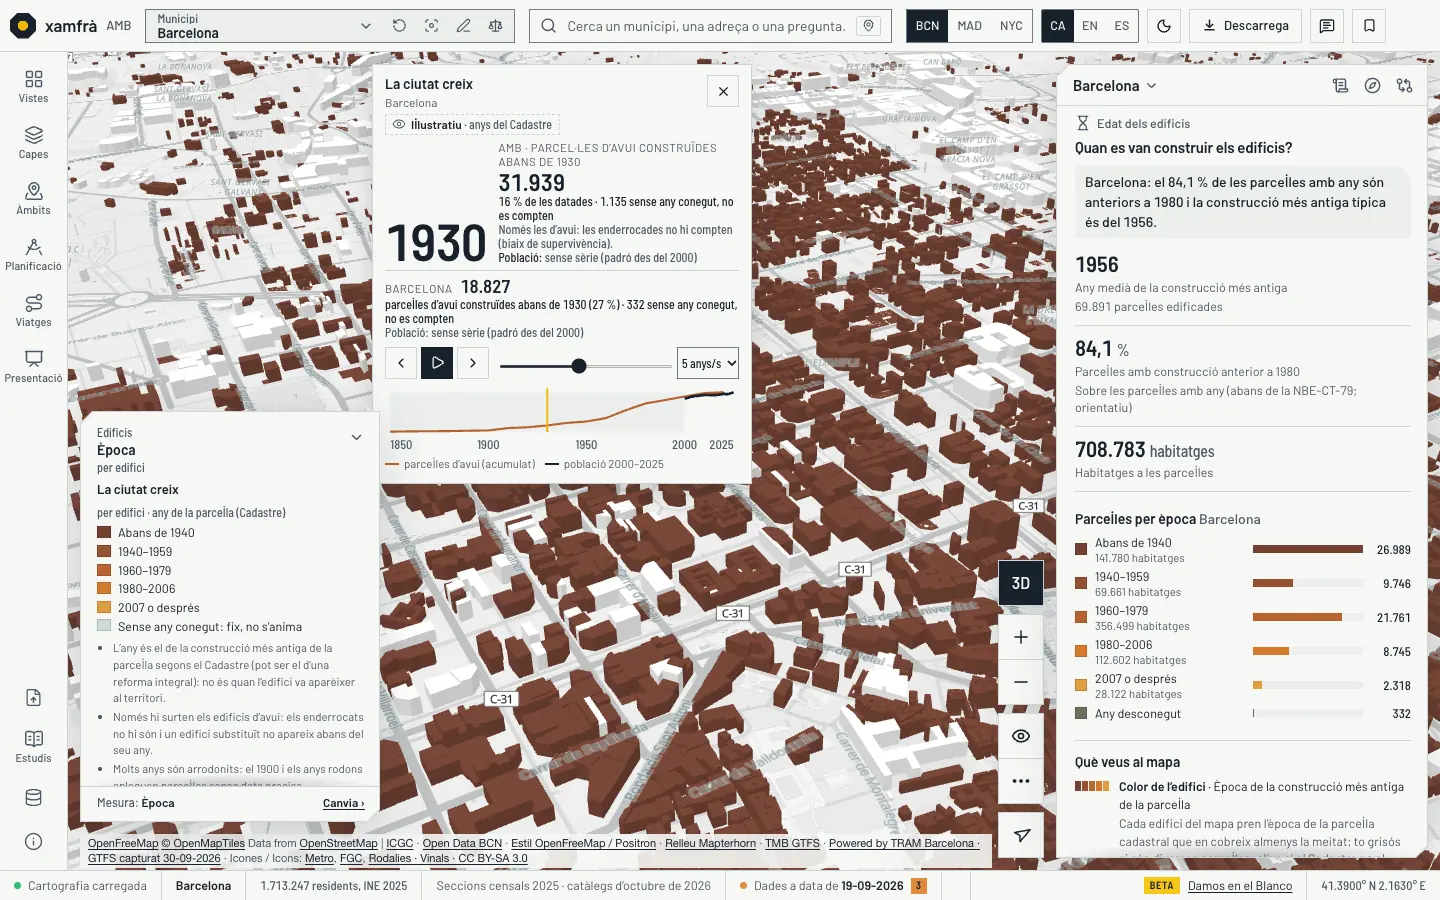
A mode of the «Building age» view: every building rises in the year of the oldest construction on its parcel, with ▶, decades, a slider and 2, 5 or 10 years per second, and pauses at 1860–1900 and 1950–1975. Beside it, the population register from 2000 to 2025 and the counter of today’s parcels built before each decade. The legend warns that the year may be that of a full refurbishment, that only buildings standing today are shown and that 1900 and round years gather imprecise dates.
Year built: Cadastre (INSPIRE, own processing per parcel). Population: municipal register (Idescat). Base map: OpenFreeMap, © OpenMapTiles, OpenStreetMap contributors data (ODbL); terrain Mapterhorn.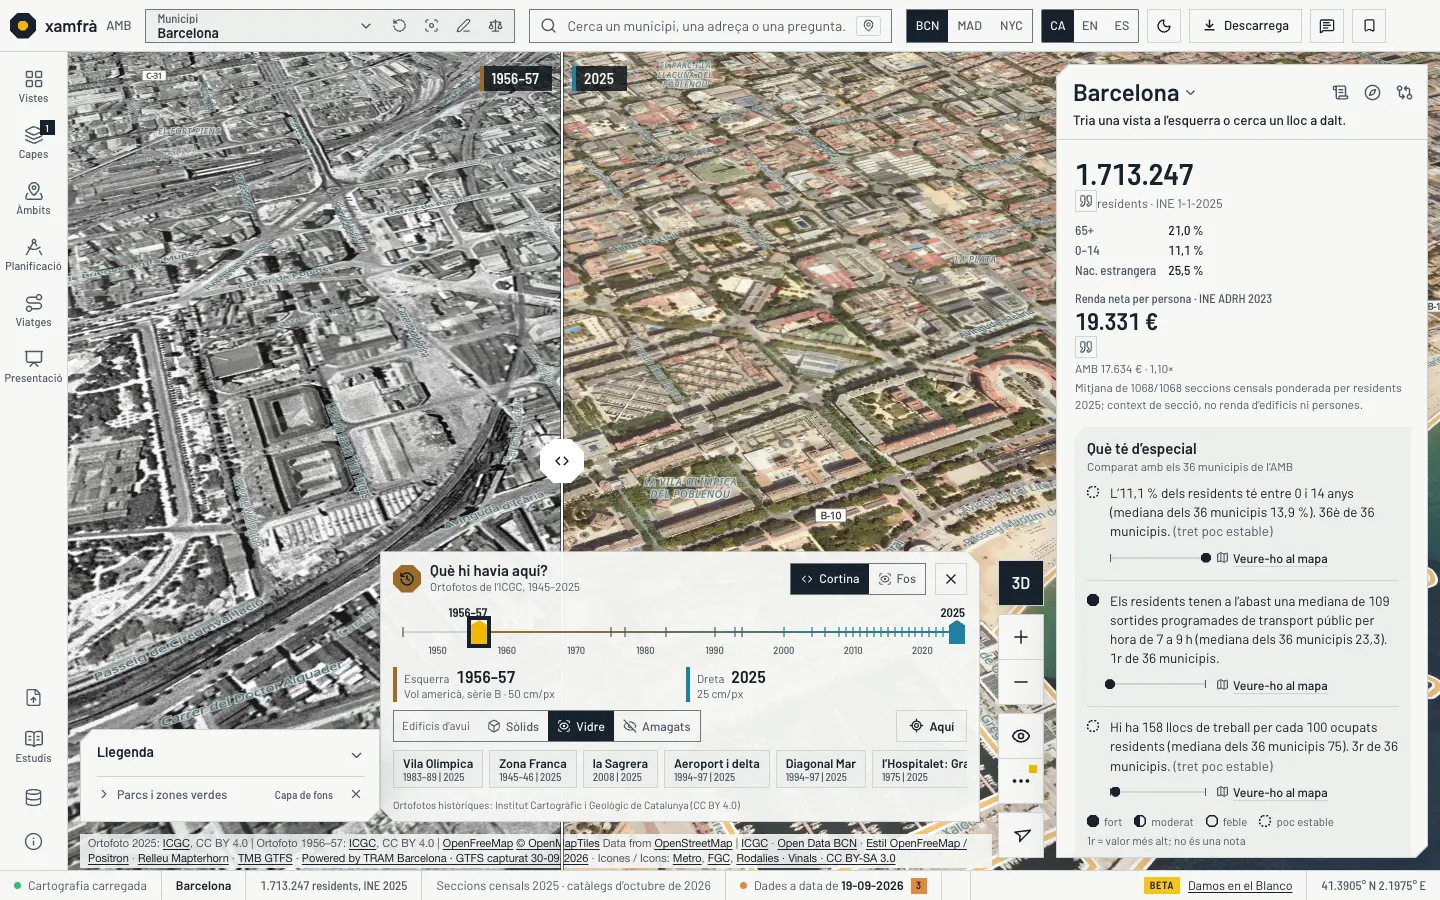
A curtain over the same map: on each side, a different year of the ICGC historic orthophotos, 29 verified flights from 1945 to 2025 (1956 | 2025 by default), in 3D too. One image can be faded into the other, and today’s buildings can be solid, glass or hidden; six places carry a short text. Maximum zoom matches each flight’s real resolution, and the viewer warns when a flight does not cover the whole area.
Orthophotos: Institut Cartogràfic i Geològic de Catalunya (CC BY 4.0); flights by MOPU (1975) and the Diputació de Barcelona (1977–79). Base map: OpenFreeMap, © OpenMapTiles, OpenStreetMap contributors data (ODbL); terrain Mapterhorn.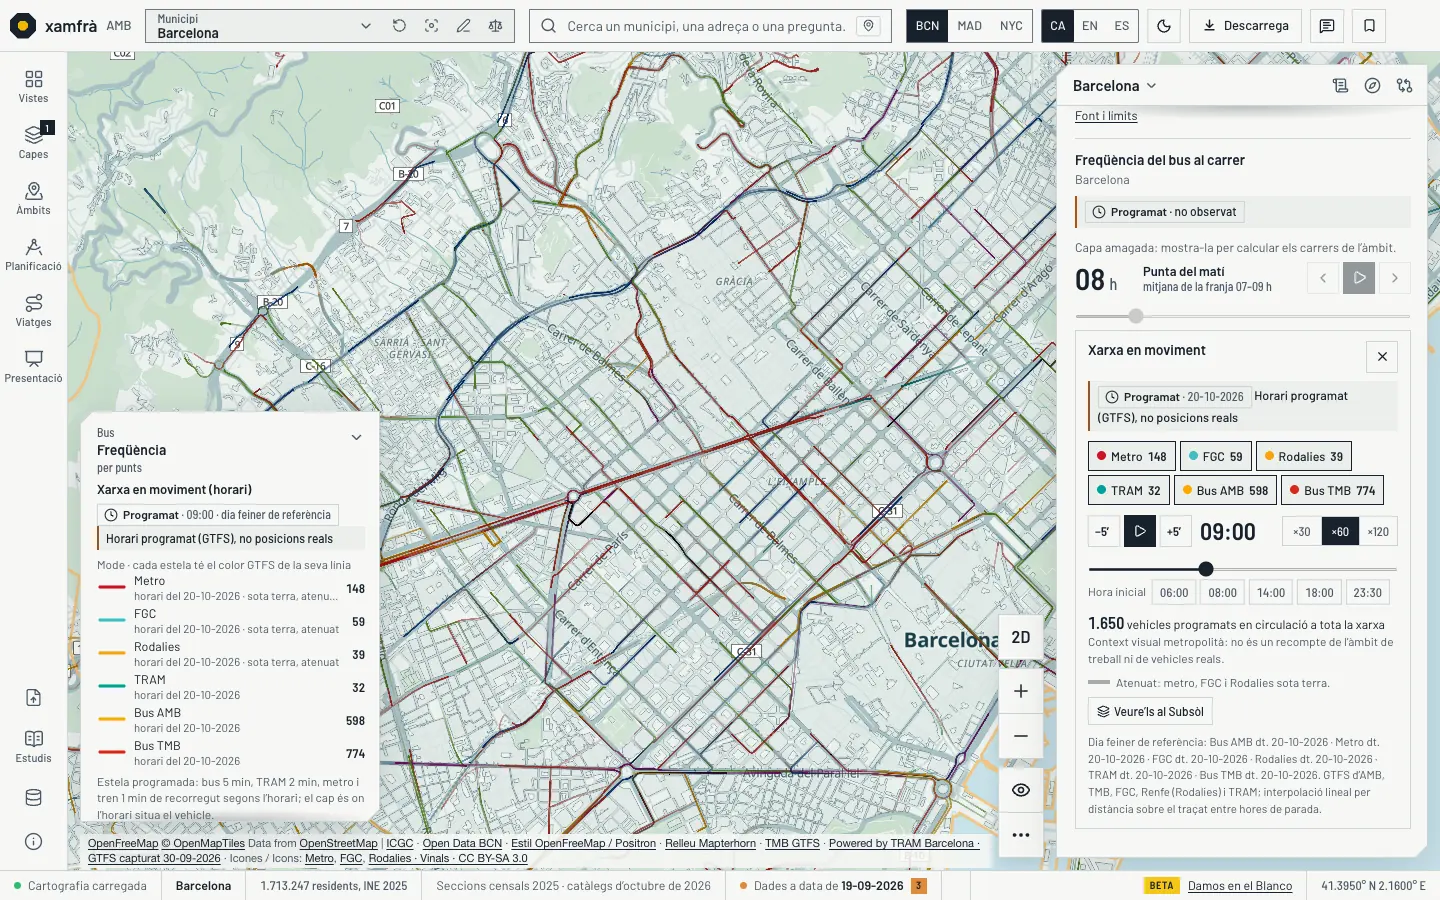
Metro, FGC, Rodalies, TRAM, AMB buses and TMB buses move at once along their routes, in each line’s colour and with a common trail, at ×30, ×60 or ×120. Chips per mode say how many scheduled vehicles are running at each moment; with the timetable published on 17 October, the peak is 1,650 vehicles at 09:00. Underground sections are shown faded and lead to the Subsòl. Always visible: «Scheduled timetable (GTFS), not real positions».
GTFS timetables of AMB, TMB, FGC, Renfe Rodalies and TRAM (scheduled, not real positions); tunnels: OpenStreetMap (ODbL). Base map: OpenFreeMap, © OpenMapTiles, OpenStreetMap contributors data (ODbL); terrain Mapterhorn.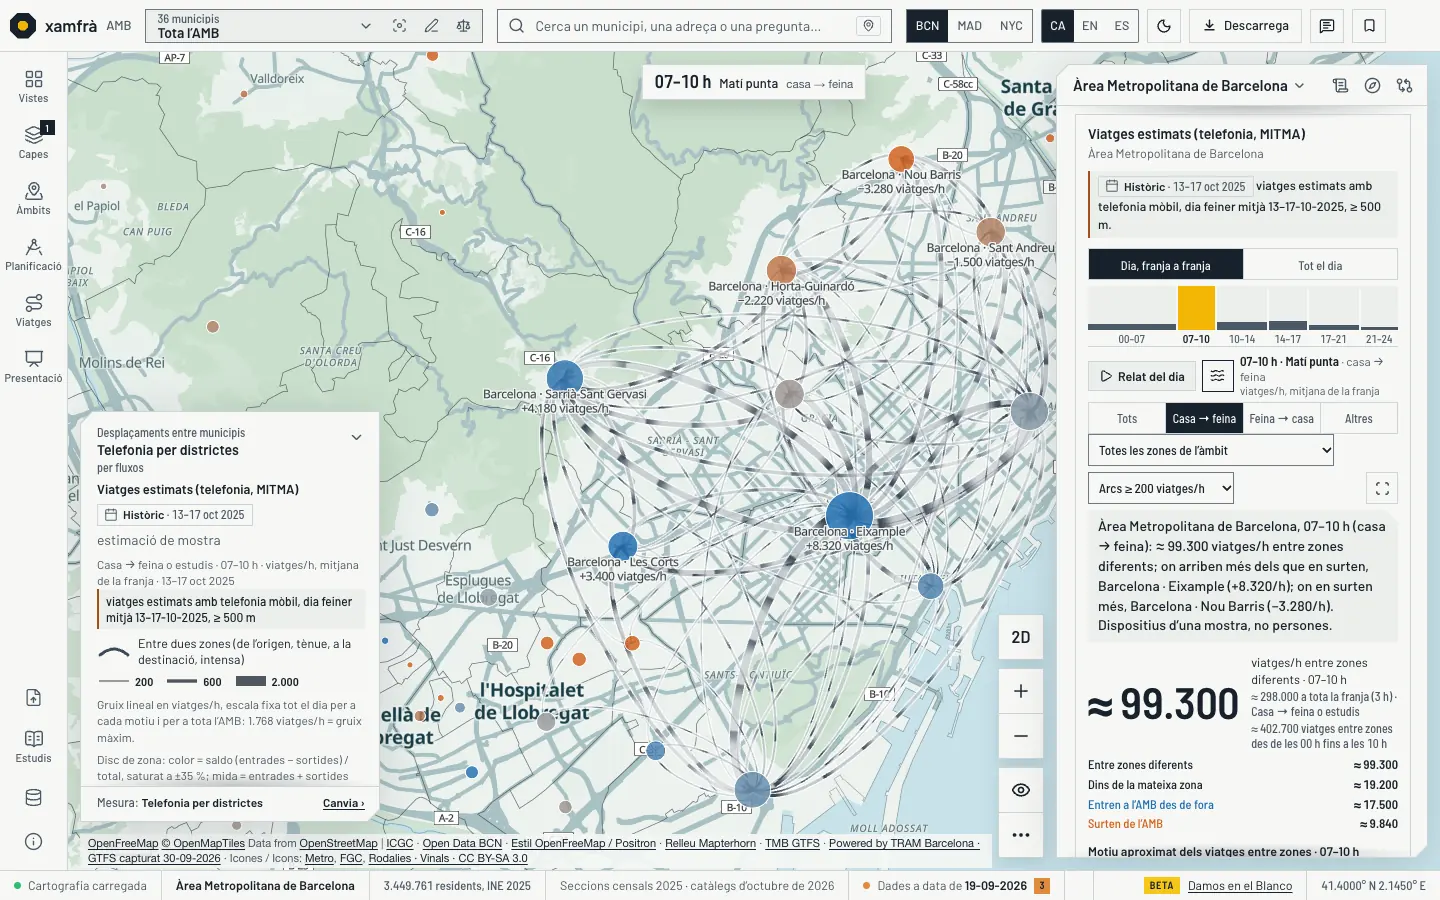
The MITMA trips view has a «Day» mode: trips per hour between zones, band by band, with a balance disc on every zone of the area (who arrives and who leaves). Arcs of 800 trips per hour or more are shown (200 for home-to-work and work-to-home), up to 150 in the AMB. «▶ Story of the day» chains home→work in the morning, work→home in the afternoon and the other purposes, with a label saying which purpose is shown.
MITMA, Big Data mobility studies (13–17 Oct 2025): an estimate from mobile phone data, not counts. Base map: OpenFreeMap, © OpenMapTiles, OpenStreetMap contributors data (ODbL); terrain Mapterhorn.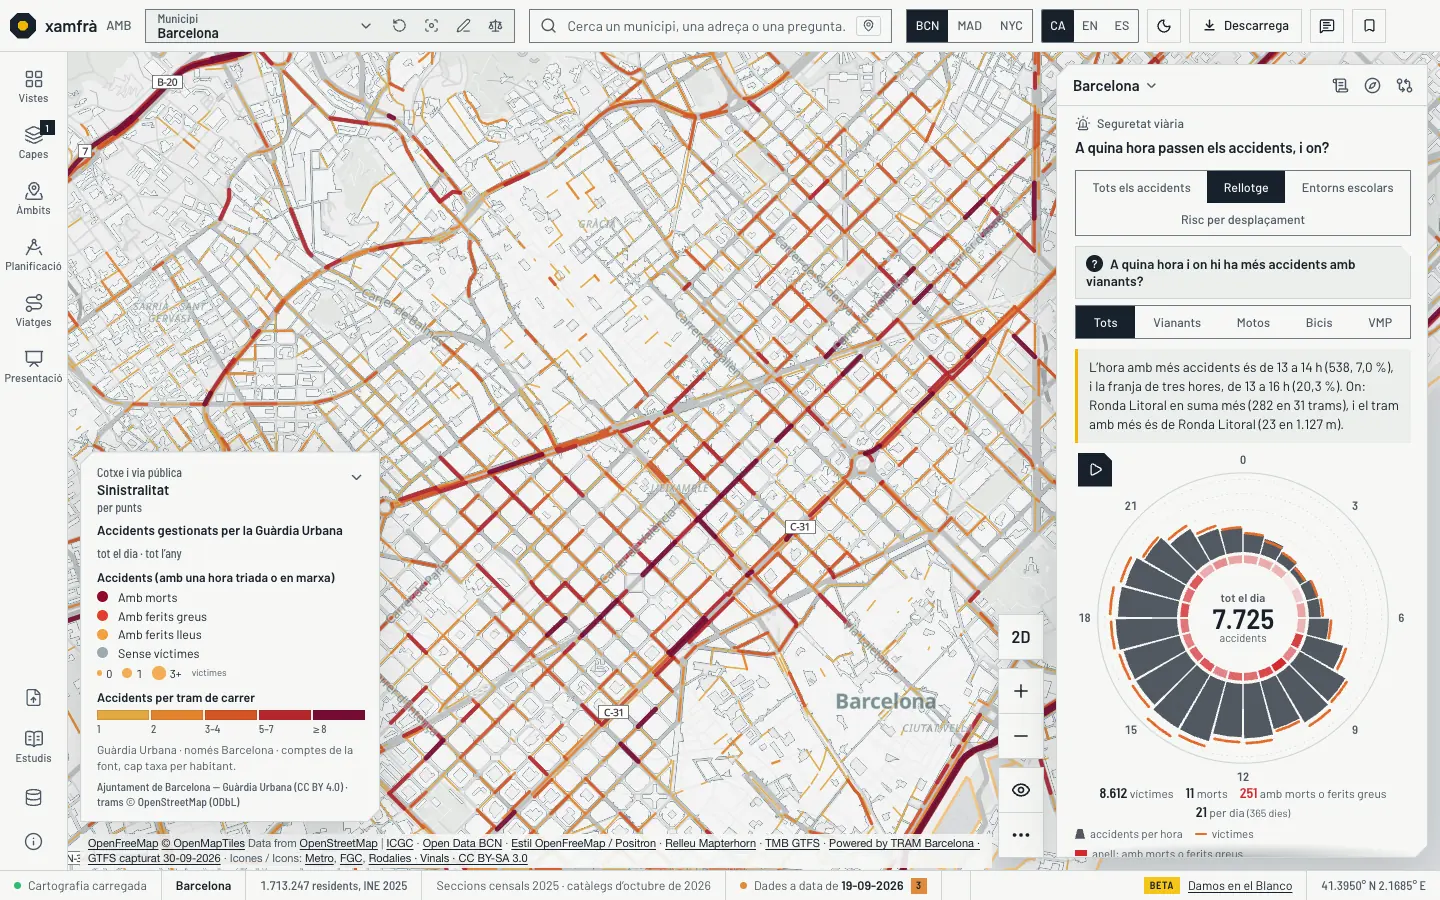
A fourth mode of «Road safety»: a 24-hour clock where the area is the number of accidents, the arc the victims and the ring the deaths or serious injuries, with filters for type of day, month, type of accident and vehicle; ▶ runs through the day. On the map, the whole day shows as density per street section and a single hour as one disc per accident. It answers «At what time and where are there more accidents involving pedestrians?». Of the 7,741 accidents of 2025, 7,517 could be placed on a street section. Barcelona only, no rate per inhabitant.
Accidents handled by the Guàrdia Urbana, 2025 (Open Data BCN, CC BY 4.0); street sections: OpenStreetMap (ODbL). Base map: OpenFreeMap, © OpenMapTiles, OpenStreetMap contributors data (ODbL); terrain Mapterhorn.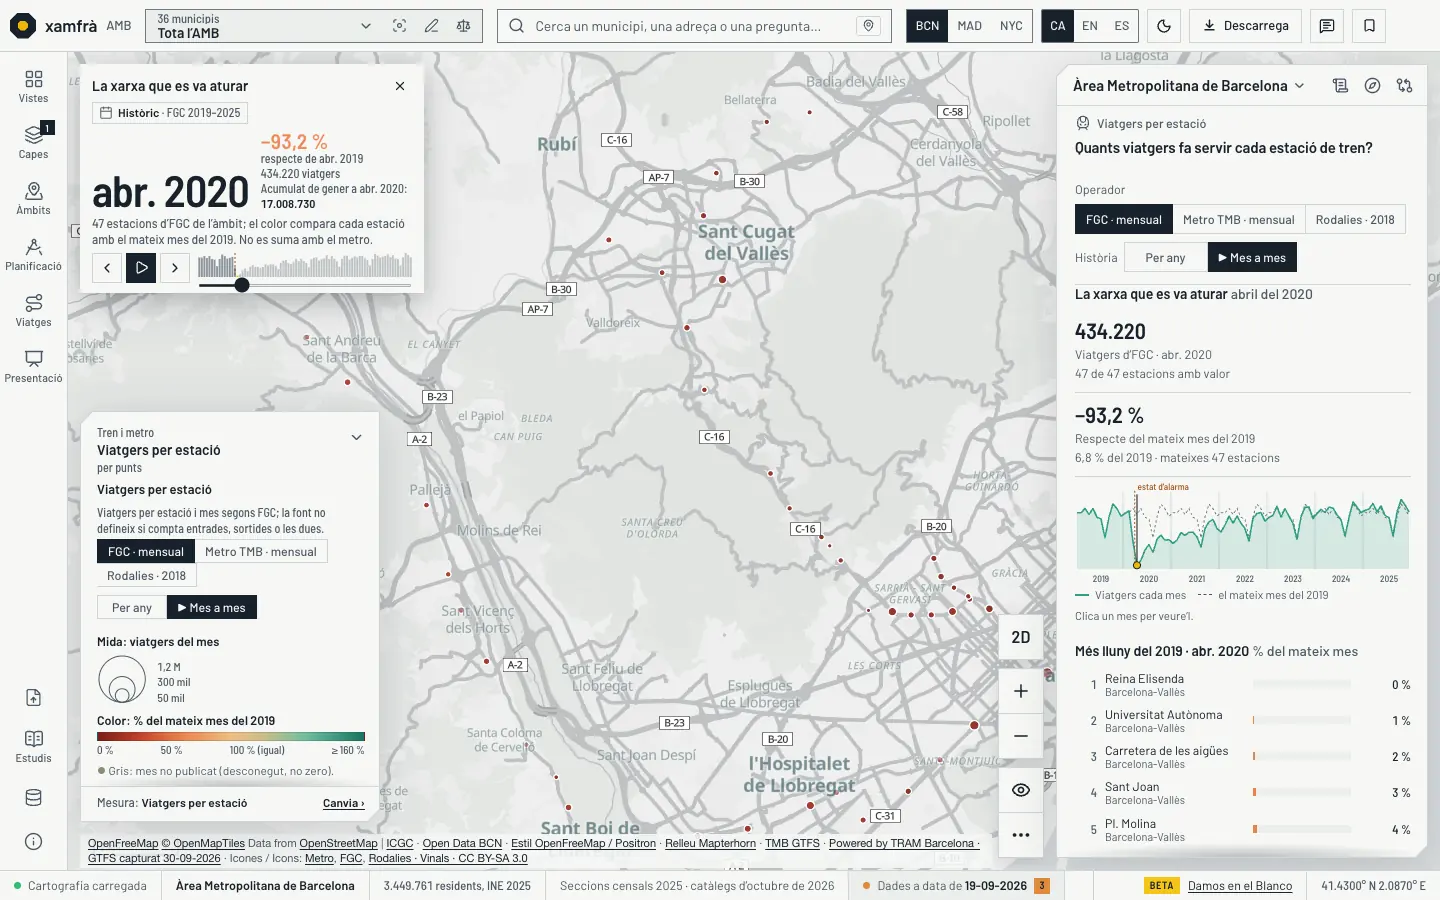
«▶ Month by month» of riders per station: FGC from 2019 to 2025 (47 stations) and metro from 2023 to 2025 (138), with discs in 2D and columns in 3D. FGC is coloured by its share of the same month in 2019: April 2020, 434,220 riders, 93.2 % fewer. The network curve has a cursor, the base-year line and the mark of the state of alarm. Operators are never added together.
Riders per station and month: FGC (2019–2025) and TMB (metro, 2023–2025; licence not declared). Base map: OpenFreeMap, © OpenMapTiles, OpenStreetMap contributors data (ODbL); terrain Mapterhorn.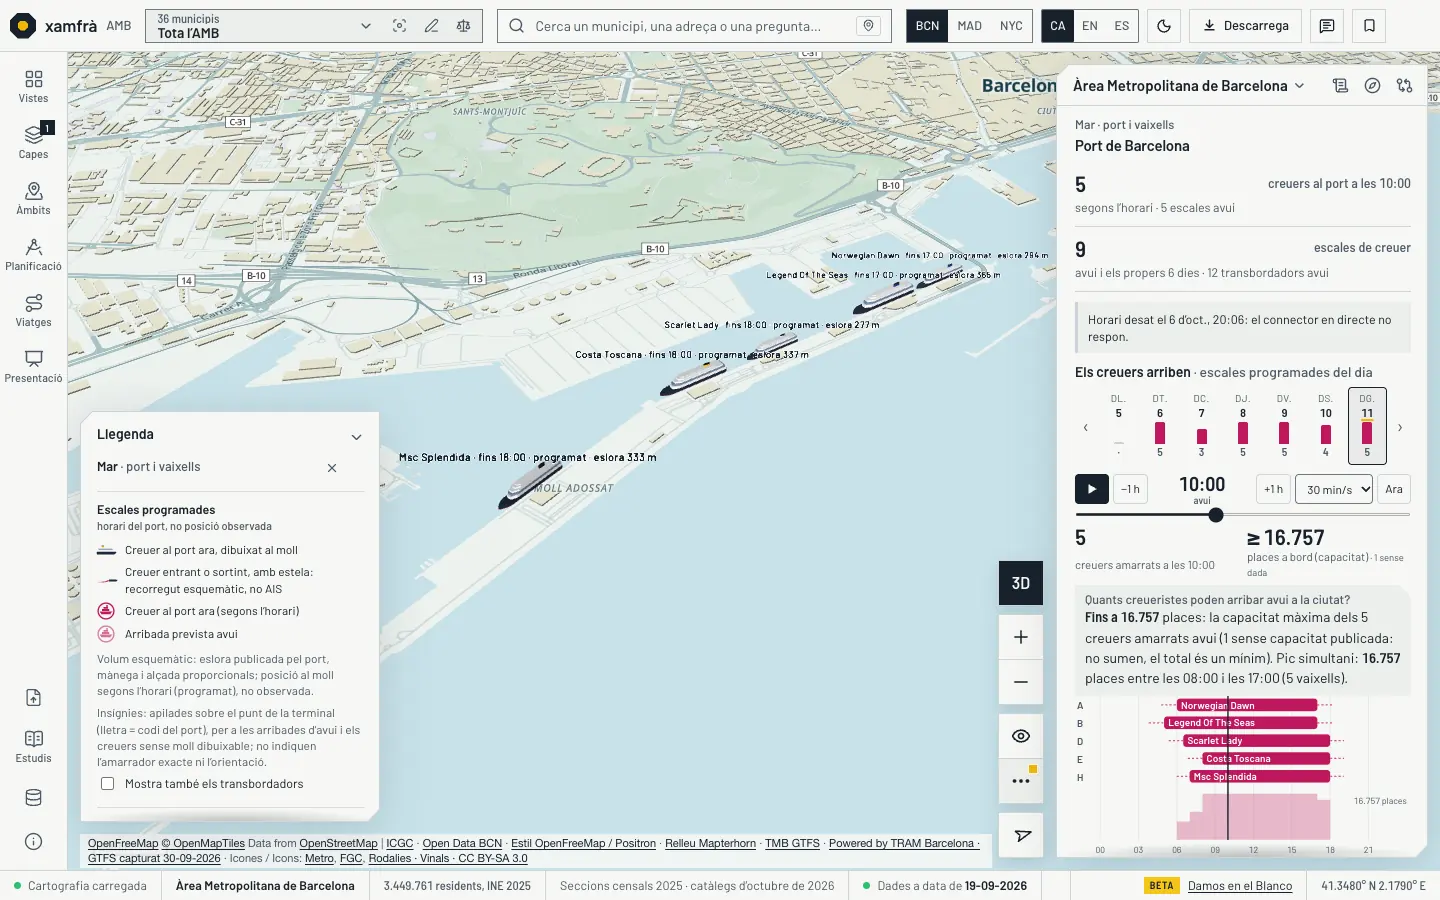
Sea mode shows the day’s scheduled cruise calls: each ship comes in from the sea, berths at its quay at its arrival time and leaves at its departure time, with its published length. The panel has the week (no timetable is «·», not zero), a clock, the timeline per terminal and the capacity on board per hour. «How many cruise passengers can arrive today?» is answered as capacity, not occupancy. The route is schematic, not AIS, and says so; when a real AIS position exists, it takes priority.
Calls: Port of Barcelona (CC BY-SA 4.0), scheduled; published capacity: Wikidata (CC0); terminals and quays: OpenStreetMap (ODbL). Base map: OpenFreeMap, © OpenMapTiles, OpenStreetMap contributors data (ODbL); terrain Mapterhorn.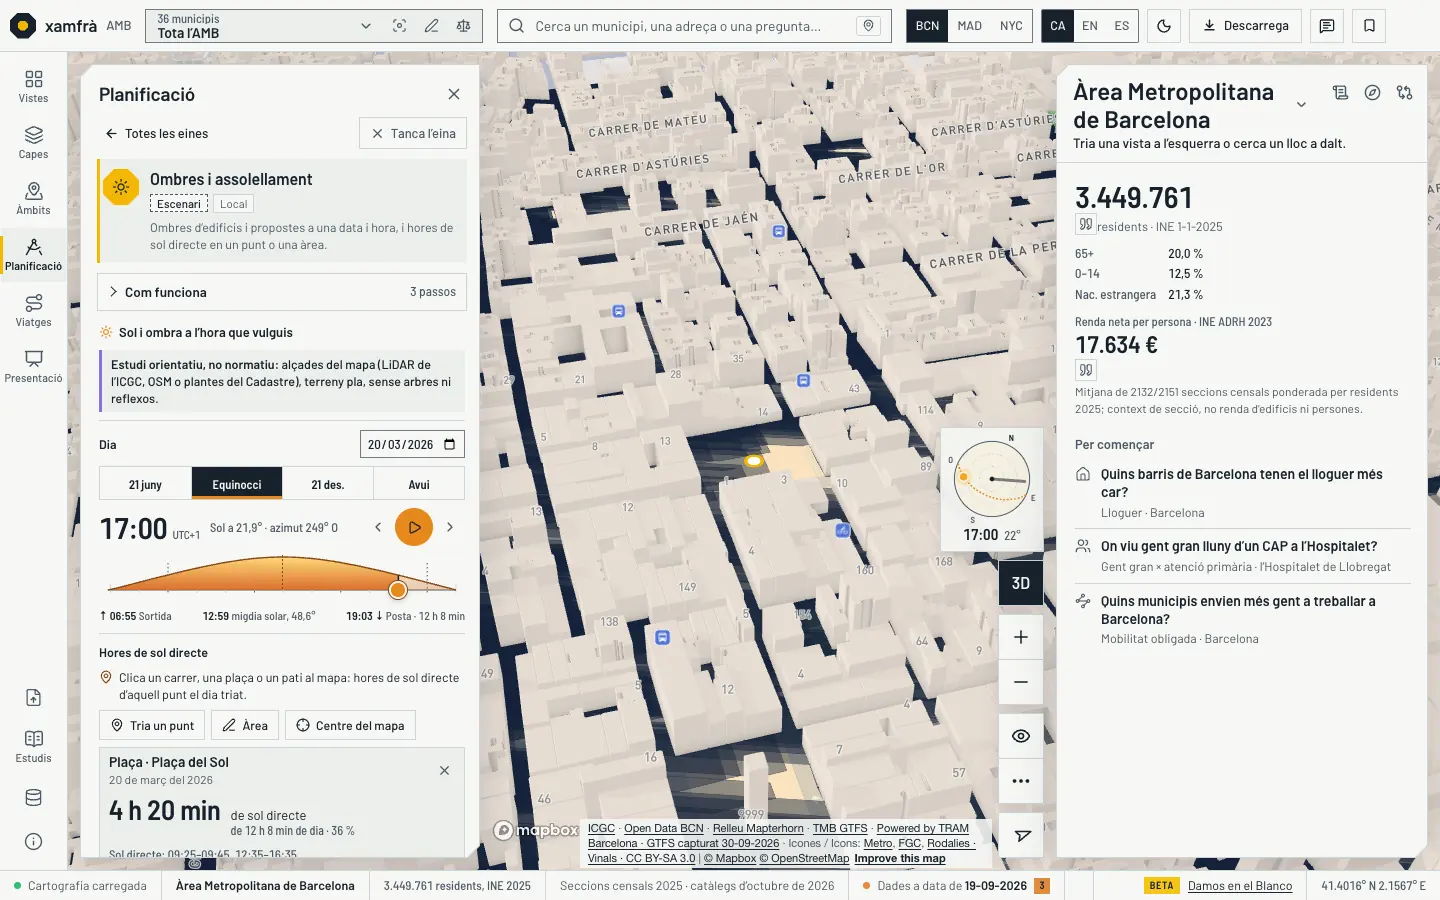
«Shadows and hours of sun» picks the day (21 June, equinox, 21 December or today) and the hour on the sun-height curve, or runs the day from sunrise to sunset in 18 seconds; a compass draws the sun’s arc on the map. A click on the ground (a street, a square, a courtyard) gives the approximate hours of direct sun for that day: in Plaça del Sol, 9 h 30 min on 21 June and 4 h 20 min at the equinox. Building heights are the real ones from the source.
Sun position checked against the US Naval Observatory; heights: ICGC LiDAR, OpenStreetMap or Cadastre. Hours of sun: an approximation. Base map: © Mapbox, © OpenStreetMap contributors (ODbL).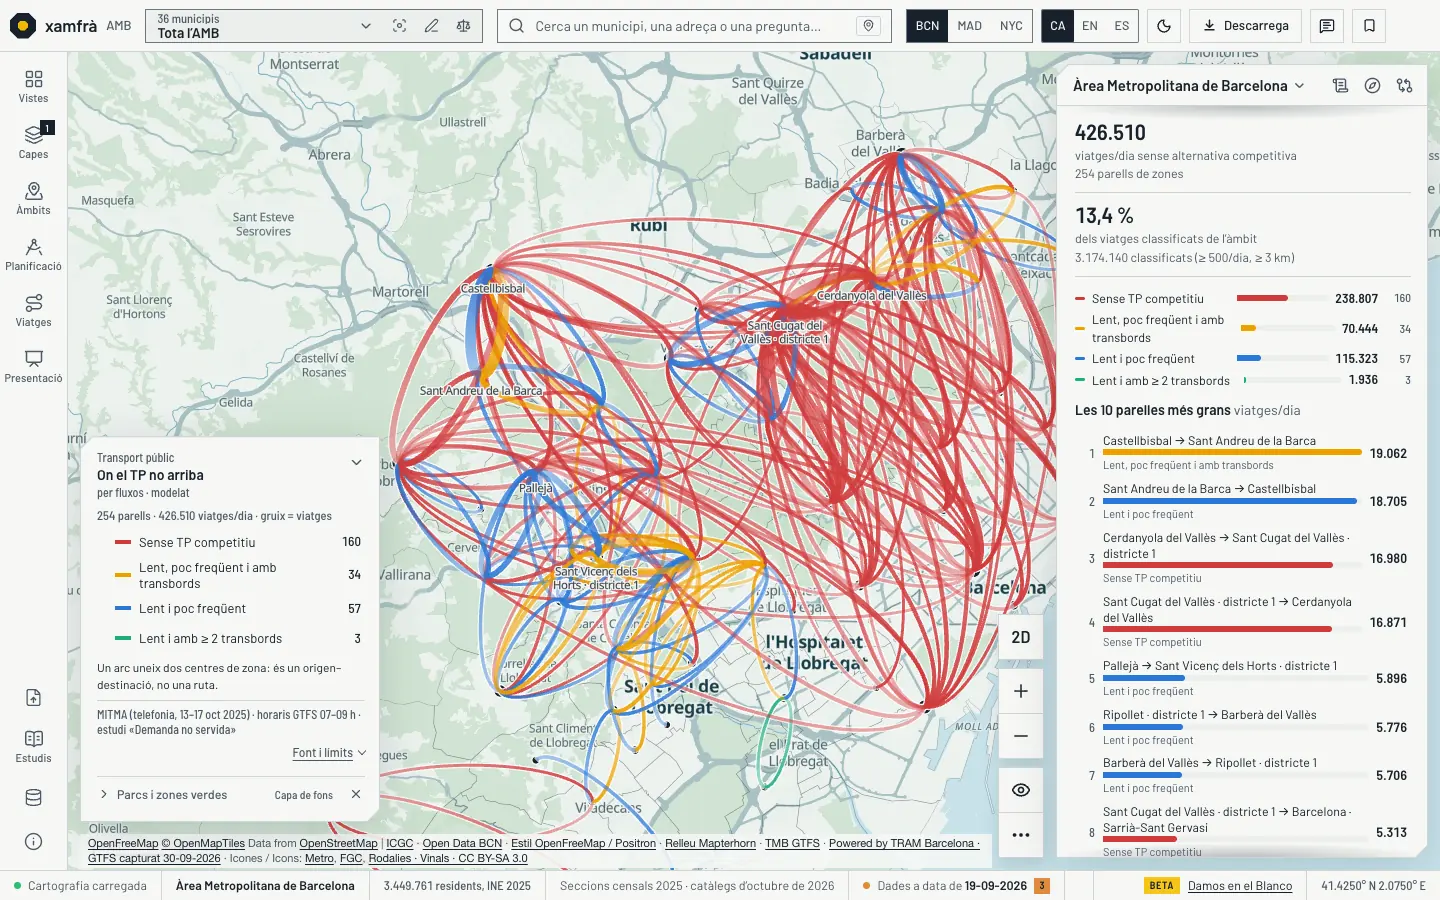
Trips between zones that public transport does not serve well, as arcs: thickness is the number of trips per day and colour the reason (no PT within 75 minutes and 2 transfers, slow and infrequent, slow with two or more transfers, or both). In the AMB there are 254 zone pairs and 426,510 trips a day, 13.4 % of the 3,174,140 classified; 238,807 have no PT option at all. A click on a zone lists its pairs with «Simulate this trip».
Own method, with MITMA trip data and other public sources. Indicative. Base map: OpenFreeMap, © OpenMapTiles, OpenStreetMap contributors data (ODbL); terrain Mapterhorn.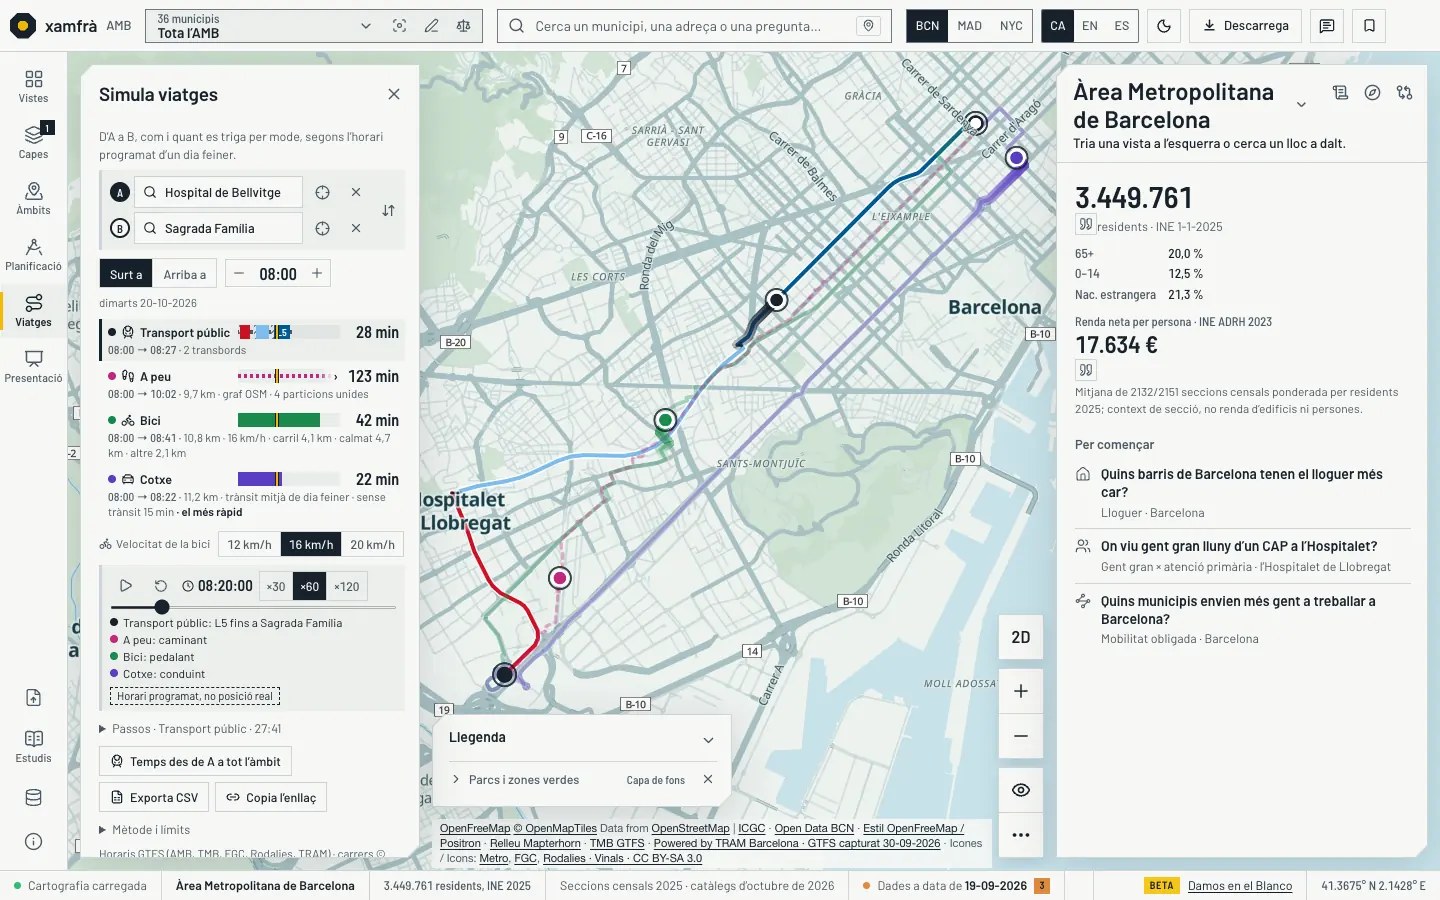
Pick A and B by address, place or facility and compare public transport (along each line’s real route), walking through the streets, cycling and driving across the AMB. The car uses average weekday traffic: in Barcelona, measured speeds by road type (ring roads 48.2 km/h, external connection roads 28.8 km/h, city average 22.9 km/h, 2017 data), and it also gives the time without traffic. It is not rush hour and does not include parking.
GTFS timetables (scheduled); street network: OpenStreetMap (ODbL); speeds: Barcelona City Council, Basic mobility data 2017; rest of the AMB, an estimate. Base map: OpenFreeMap, © OpenMapTiles, OpenStreetMap contributors data (ODbL); terrain Mapterhorn.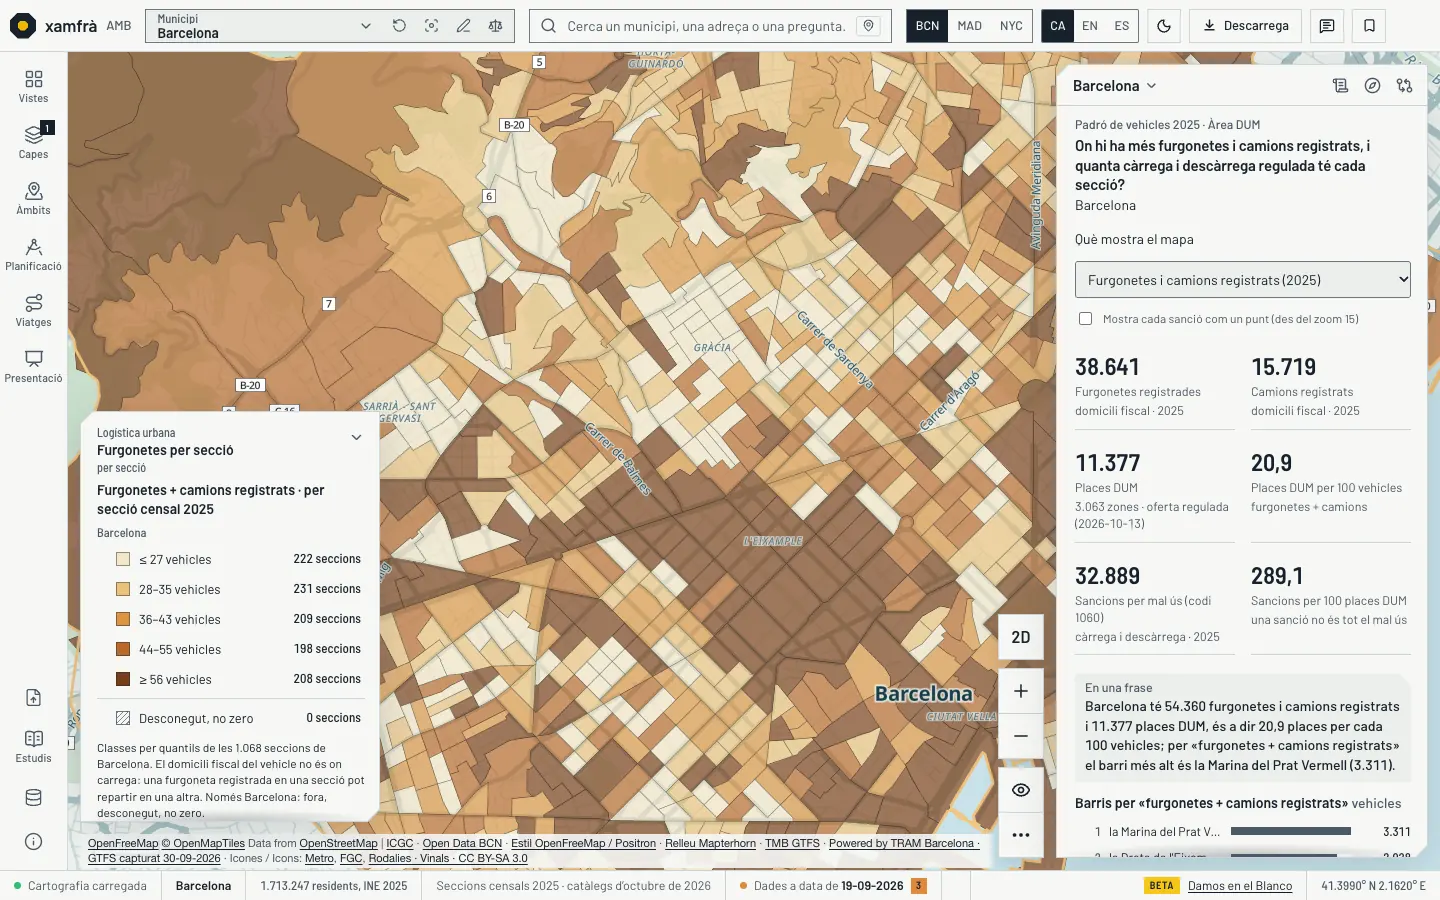
A new family of views for urban goods distribution: vans and lorries per section in Barcelona with the loading and unloading bays (DUM) and the 32,889 fines for misuse of the DUM in 2025; business parks and flooding, with 184 logistics establishments from the GIA census; petrol stations by diesel price; 1,151 parcel lockers and pick-up points; and electric vans registered by municipality.
Barcelona City Council (vehicles, DUM area and fines; Open Data BCN), Generalitat (GIA census and SIPAE estates), MITECO (fuel prices), DGT (registrations) and locker operators. Some have their licence to be verified or declared, and the viewer flags it. Base map: OpenFreeMap, © OpenMapTiles, OpenStreetMap contributors data (ODbL); terrain Mapterhorn.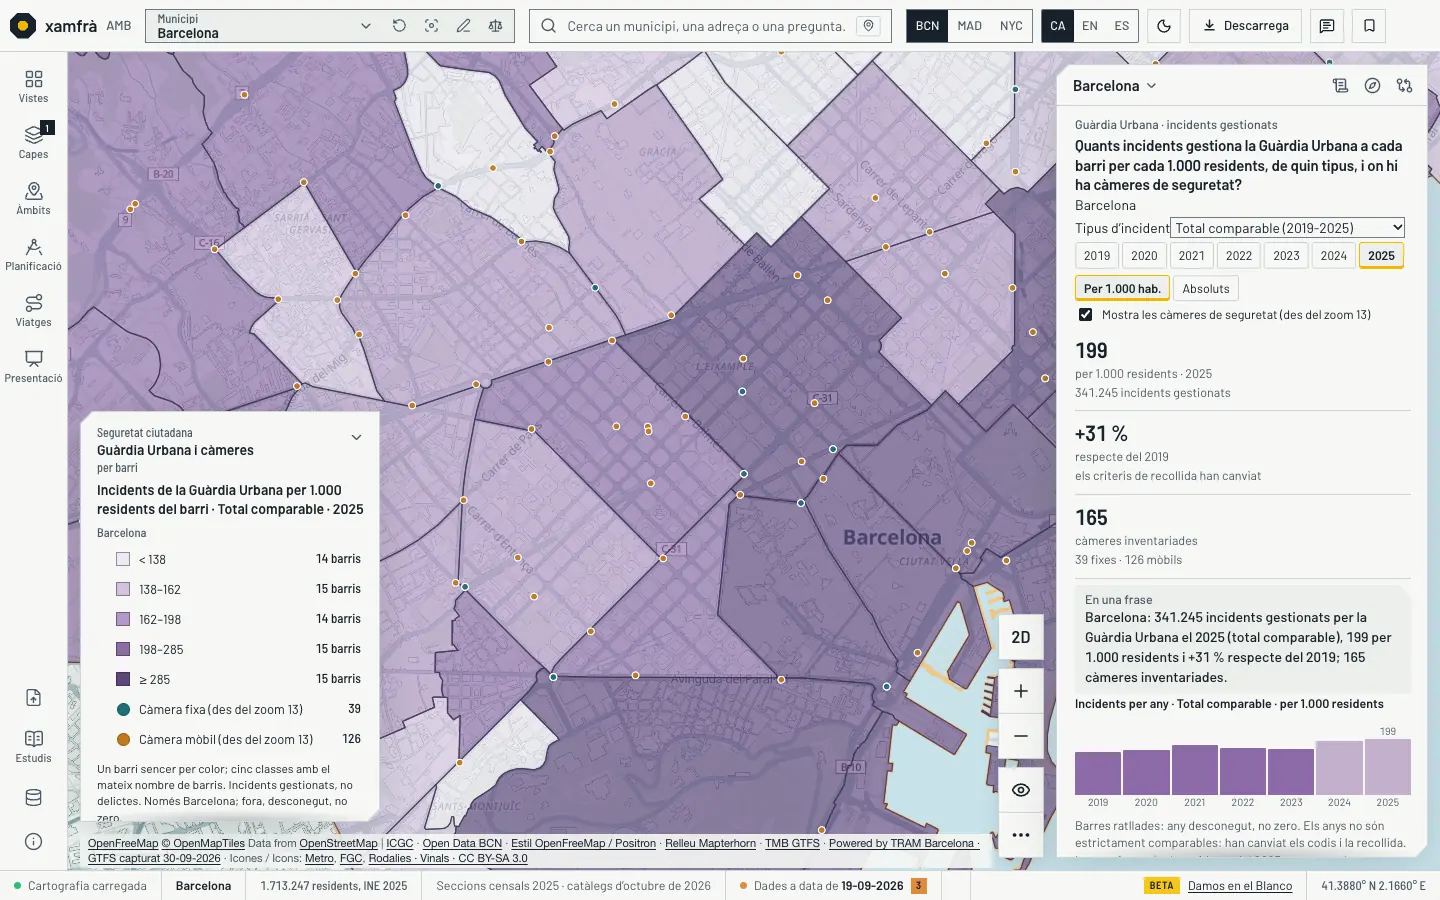
A new family with the incidents handled by the Guàrdia Urbana per neighbourhood, incident family and year, from 2010 to 2025, and the 165 municipal cameras. The years 2024 and 2025 are incomplete at the source and are flagged as such. They are incidents handled, not crimes or reports.
Guàrdia Urbana and camera inventory of Barcelona City Council (Open Data BCN, CC BY 4.0). Barcelona only. Base map: OpenFreeMap, © OpenMapTiles, OpenStreetMap contributors data (ODbL); terrain Mapterhorn.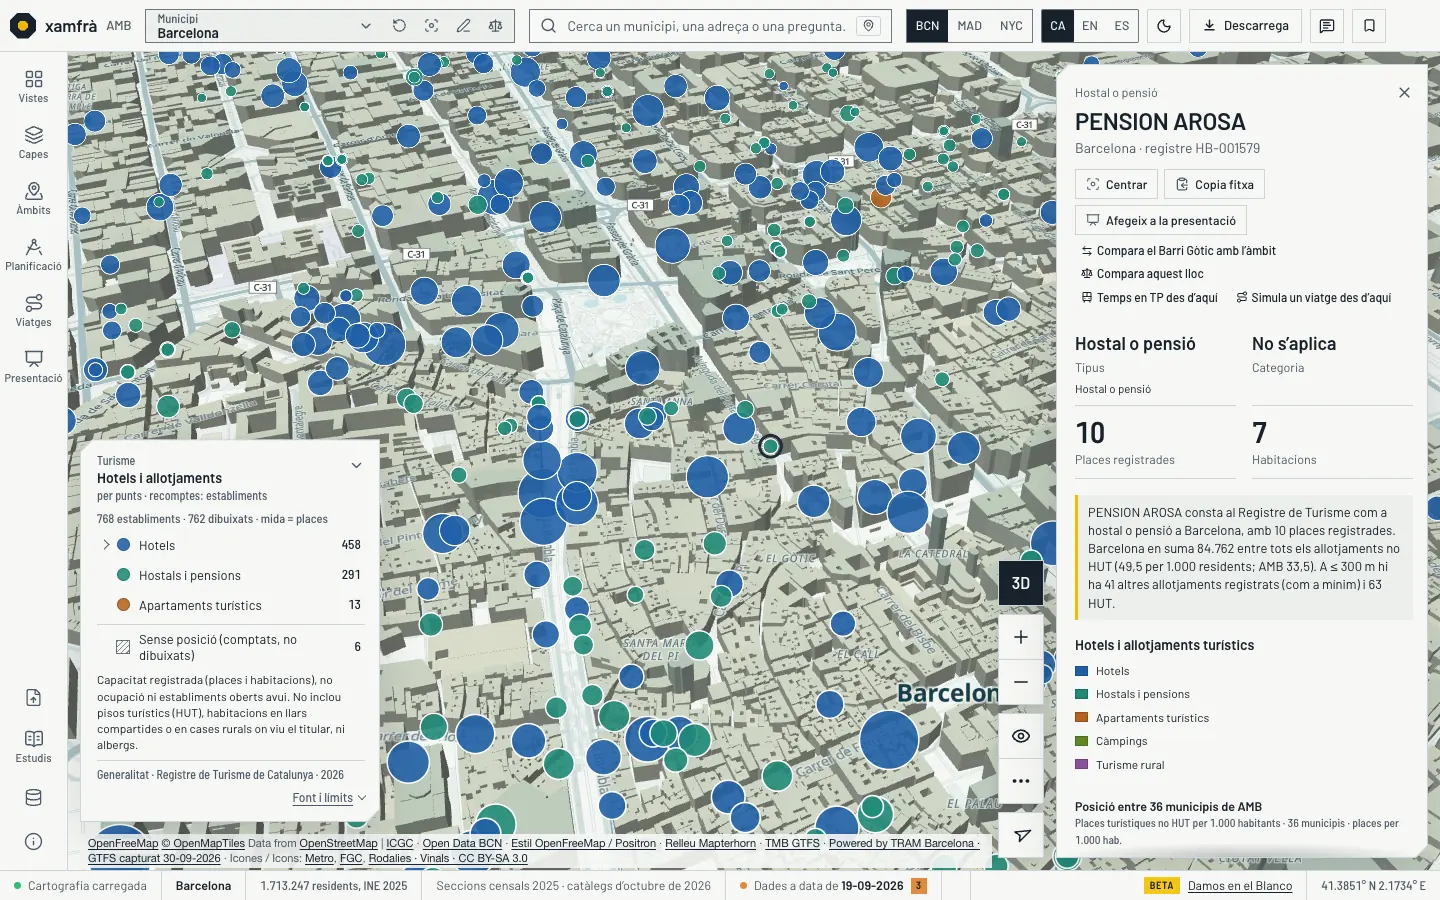
Items that only had a small popup, a hover text or nothing now open a card in the right panel with figures, position and context: a climate shelter with its services, a hotel with the lodgings and the tourist dwellings within 300 m, a fire station with the sections and dwellings it serves, a road section with its rank in the network. A click on the painted ground opens the section’s full card, and the municipality’s where the data are municipal.
Base map: OpenFreeMap, © OpenMapTiles, OpenStreetMap contributors data (ODbL); terrain Mapterhorn.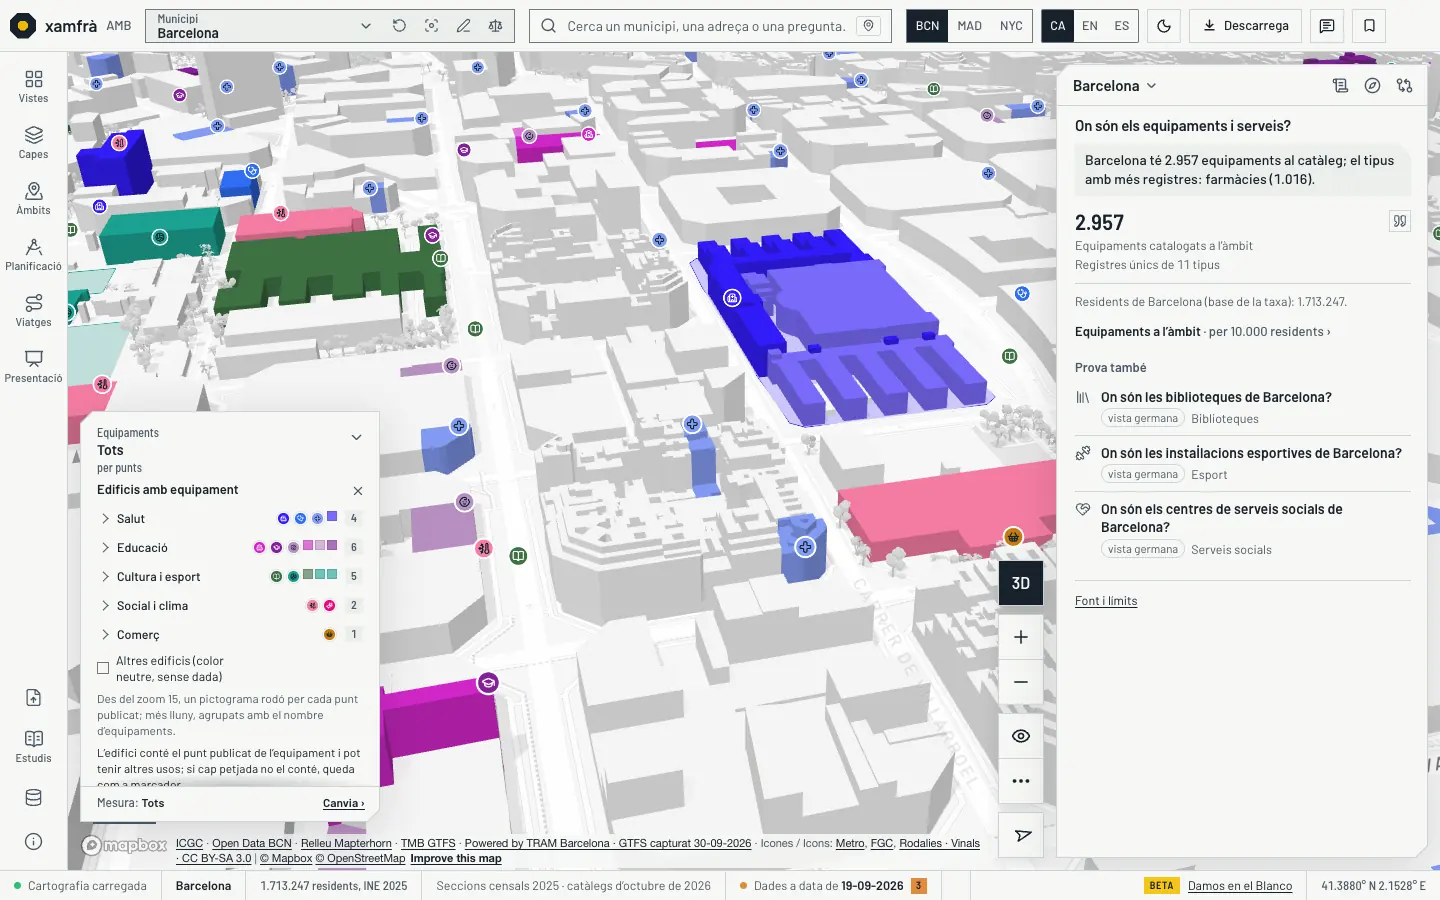
With the 3D engine, a facility marker (the octagon and its pictogram) sits on top of its building’s roof instead of being buried in it. In 2D, or with the buildings hidden, it goes back to the ground.
Base map: © Mapbox, © OpenStreetMap contributors (ODbL).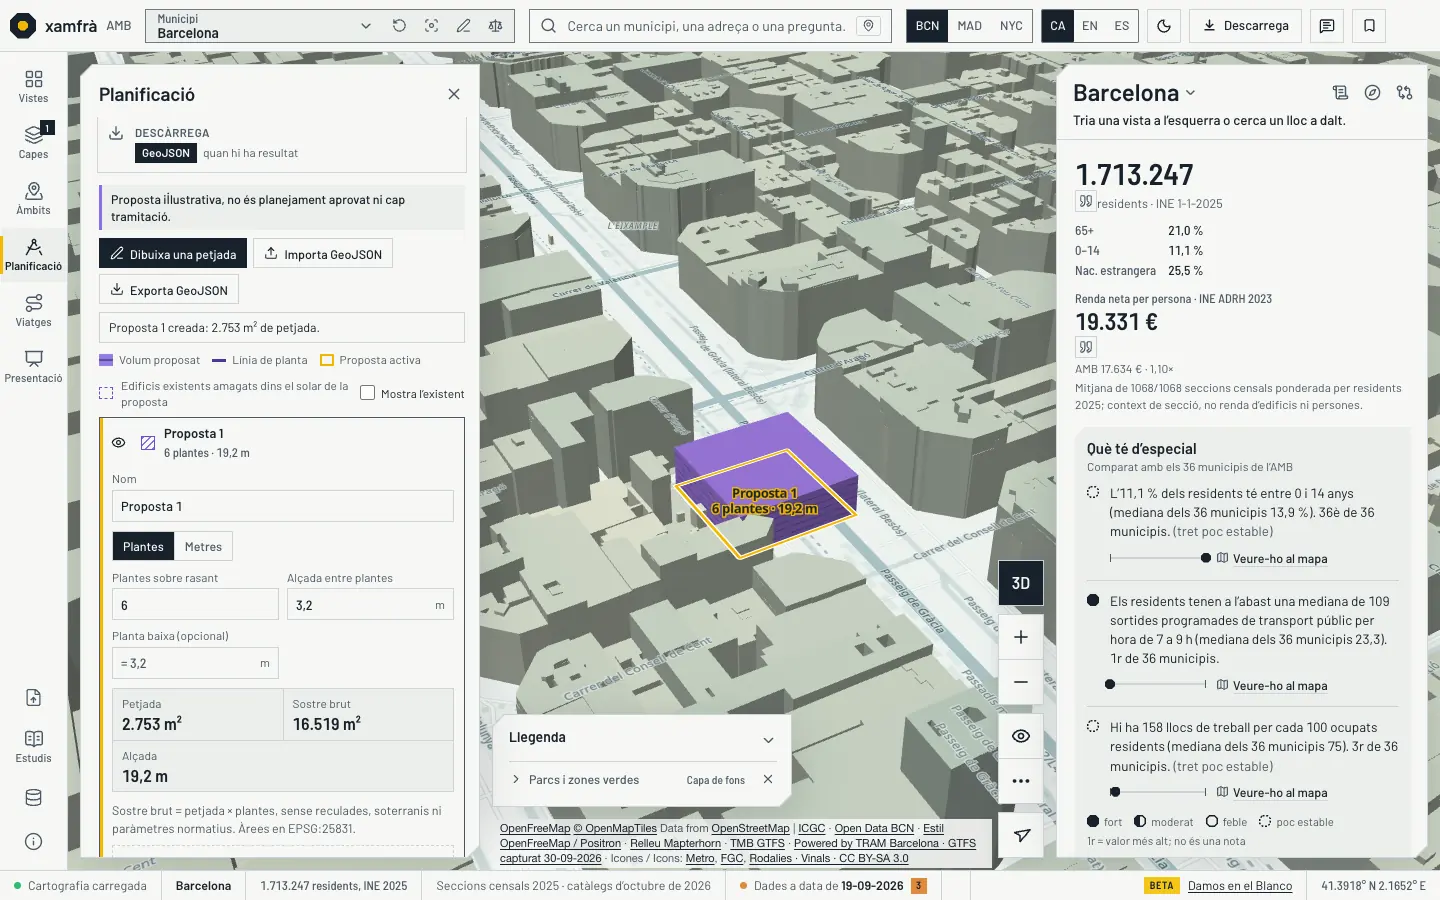
In the scenario tools (volumetric proposal, densification and volume import), today’s buildings inside the proposal’s plot are hidden, so the new volume is not mixed up with what is already there. The legend has a row for it, with «Show what exists» to see them again. Outside the scenarios nothing changes.
Hand-drawn scenario, not a project. Base map: OpenFreeMap, © OpenMapTiles, OpenStreetMap contributors data (ODbL); terrain Mapterhorn.Also on 16 October
Rodalies in a day
«▶ Hour by hour» for Rodalies: a 24-hour clock of boardings and alightings per station, in 48 half hours (2018, type of day not declared by the source). Hours without a row are unknown, not zero.
Air-raid shelters
1,240 shelters from the Archaeological Map, in the «Heritage» family and as a Subsòl group, with a symbolic marker: the source does not give their depth.
Subsòl at real scale
Subsòl mode now opens with vertical scale ×1, the real one, like the vertical section; ×3 and ×5 are still available.
News · 14 and 15-10-2026 · A common trail, parks on foot and risks
14 and 15 October 2026. One trail for everything that moves, the walking minutes to the park for every building and three views of technological and seismic risks with the dwellings nearby. Real screenshots of the test viewer (interface in Catalan, light theme).
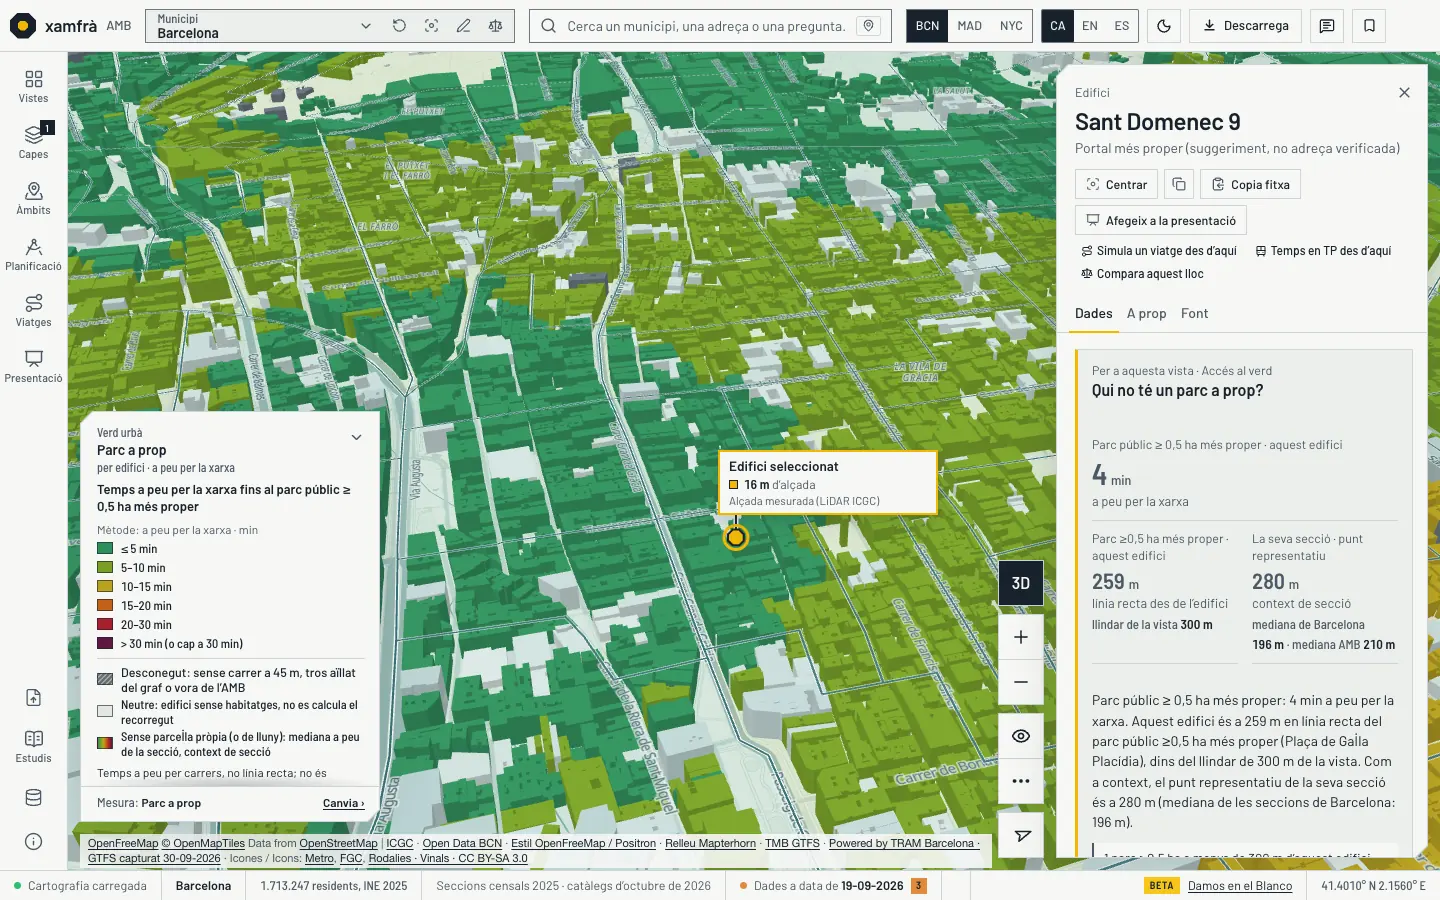
«Park nearby» paints every building by the walking minutes to the nearest public park, along the streets (the straight line remains as an alternative), and the headline is read at 5 minutes: 31.4 % of the AMB’s dwellings are more than 5 minutes away on foot, 29.5 % in Barcelona and 26.1 % in L’Hospitalet. At 15 minutes, the figure was 1.3 % in the AMB.
Parks and street network: OpenStreetMap (ODbL); dwellings: Cadastre (INSPIRE). Base map: OpenFreeMap, © OpenMapTiles, OpenStreetMap contributors data (ODbL); terrain Mapterhorn.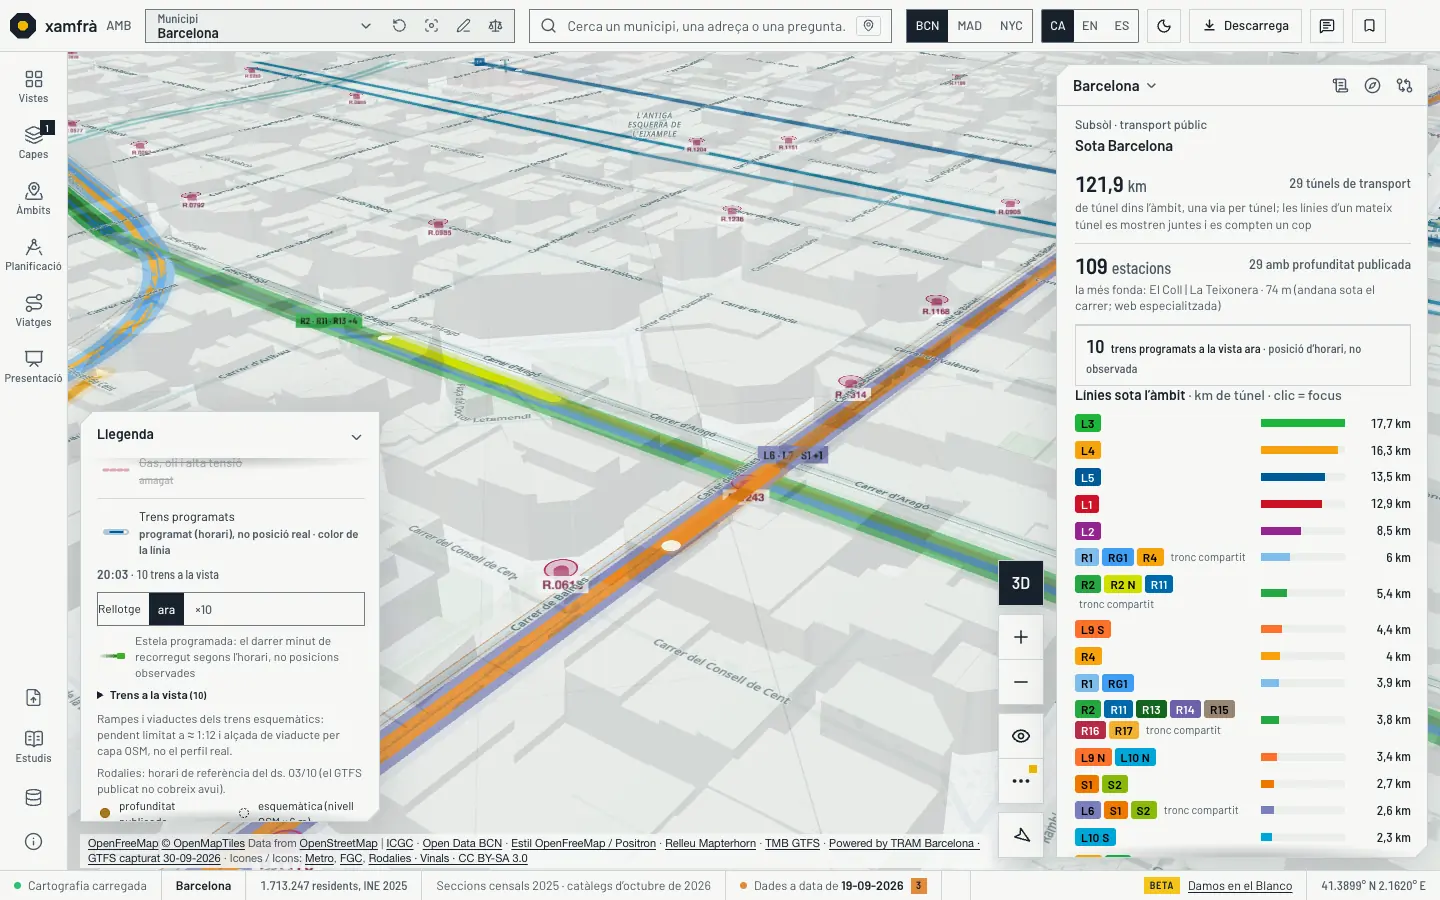
Subsòl trains, aircraft, ships, buses and the traveller of «Time by PT» now share the same trail: a fading tail and a haloed head, in the theme’s colours. The legend draws a sample and says what each trail is: «Scheduled trail» for timetables, «Observed trail» for received positions.
GTFS timetables of TMB, FGC and Renfe Rodalies (scheduled, not real positions); tunnels: OpenStreetMap (ODbL). Base map: OpenFreeMap, © OpenMapTiles, OpenStreetMap contributors data (ODbL); terrain Mapterhorn.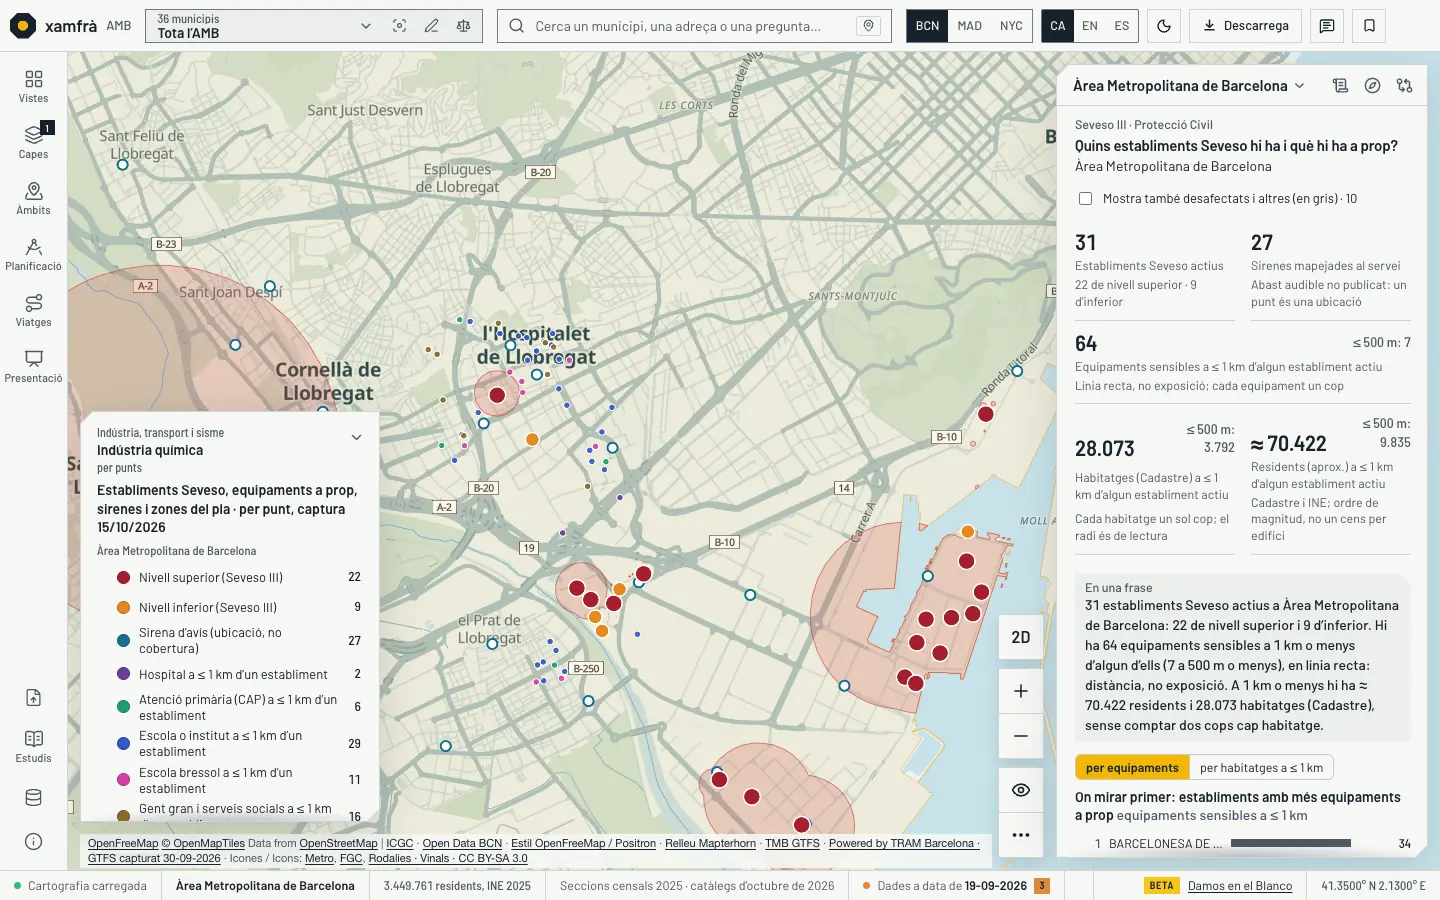
Three new views in «Risks and emergencies»: Seveso establishments by level, with the sirens and plan zones and the sensitive facilities within 1 km; routes for dangerous goods by hazard level and heavy vehicles per day; and the seismic intensity of each municipality, with every building by construction period from zoom 14. Dwellings and residents nearby are counted only once for the AMB, and the 500 m and 1 km rings are a reading radius, not a risk zone.
Civil Protection of the Generalitat (Seveso, PLASEQCAT, TRANSCAT, earthquakes), traffic counts and Cadastre (INSPIRE). Dwellings and residents nearby: own method, approximate (≈). Base map: OpenFreeMap, © OpenMapTiles, OpenStreetMap contributors data (ODbL); terrain Mapterhorn.Also on 15 October
Subviews with icon and colour
In the «Views» drawer, each family opens the list of its subviews, each one with its icon in the view’s colour and a sample of its colours; the closed tile already shows the icons of its subviews. The same number of families fits on screen as before.
Simulate trips
The «Simulate trips» drawer arrives: from A to B by public transport along the real GTFS routes and on foot through the streets, with the journey replayed on the map and a link to «Time by PT». Bike and car were added on 16 October.
News · 13-10-2026 · Order and cross-referencing
13 October 2026. One drawer to find the views, two new per-building detectors with their validation published, tables and reports you can download and cite, search by cadastral reference, and the data with its licence in plain sight. Real screenshots of the test viewer (interface in Catalan).
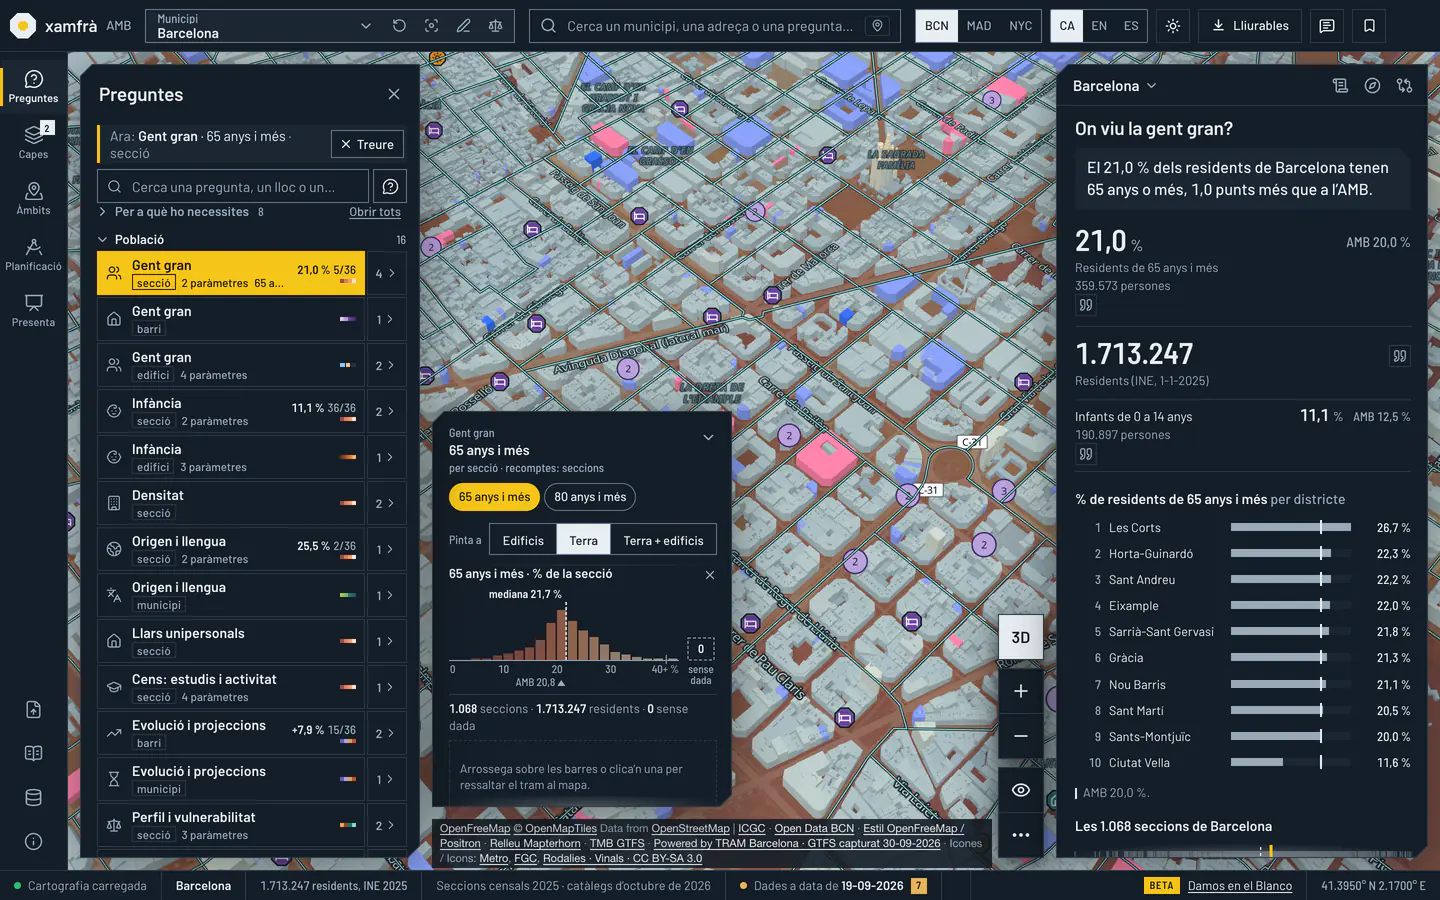
The «Questions» drawer gathers the viewer’s 109 questions in nine themes. Each row says its unit (section, neighbourhood, building, municipality…) and how many variants it has, and the legend keeps the parameters. You can search a question, a place or a figure, or start from «What you need it for»: eight bundles of municipal plans. Every row has an example question: «Where do most older residents live in Badalona?» or «Which Barcelona neighbourhoods have the highest rents?».
Older residents by census section: INE, 1-1-2025; the value is that of the whole section, not of each building’s residents. Basemap: OpenFreeMap, © OpenMapTiles, OpenStreetMap contributors’ data (ODbL); Mapterhorn relief.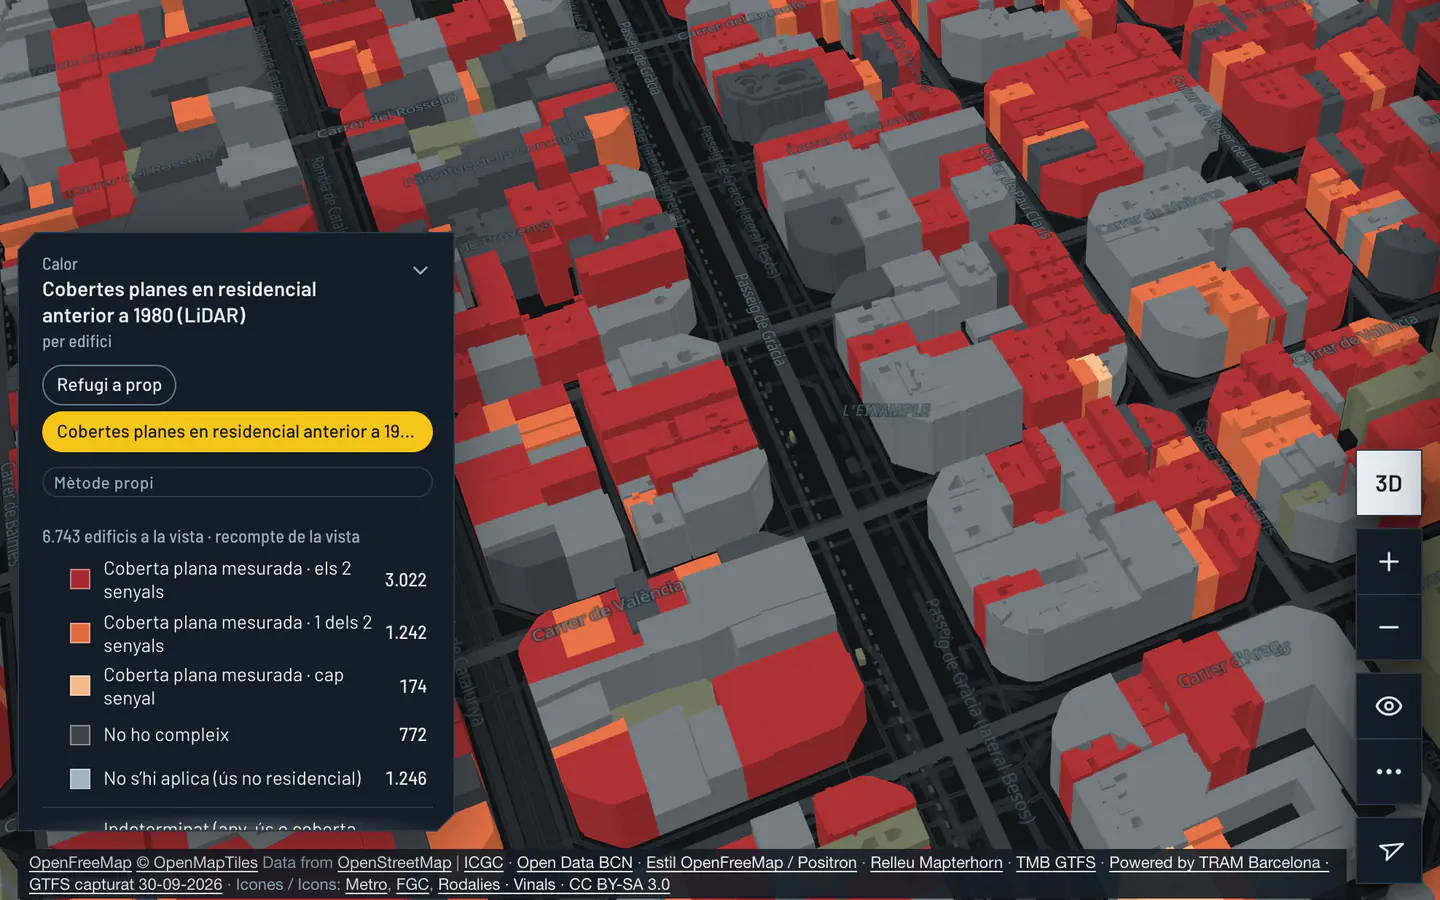
XM·CPR in the Eixample of Barcelona. Each building takes the colour of its parcel’s answer, counted by criteria and never weighted; where the question does not apply or the data are not enough to decide it, the building is drawn apart and the legend gives the count. It is not a thermal diagnosis or a project.
Own method XM·CPR, with Cadastre data (INSPIRE, own processing, 2026) and other public sources. Indicative, not normative. Basemap: OpenFreeMap, © OpenMapTiles, OpenStreetMap contributors’ data (ODbL); Mapterhorn relief.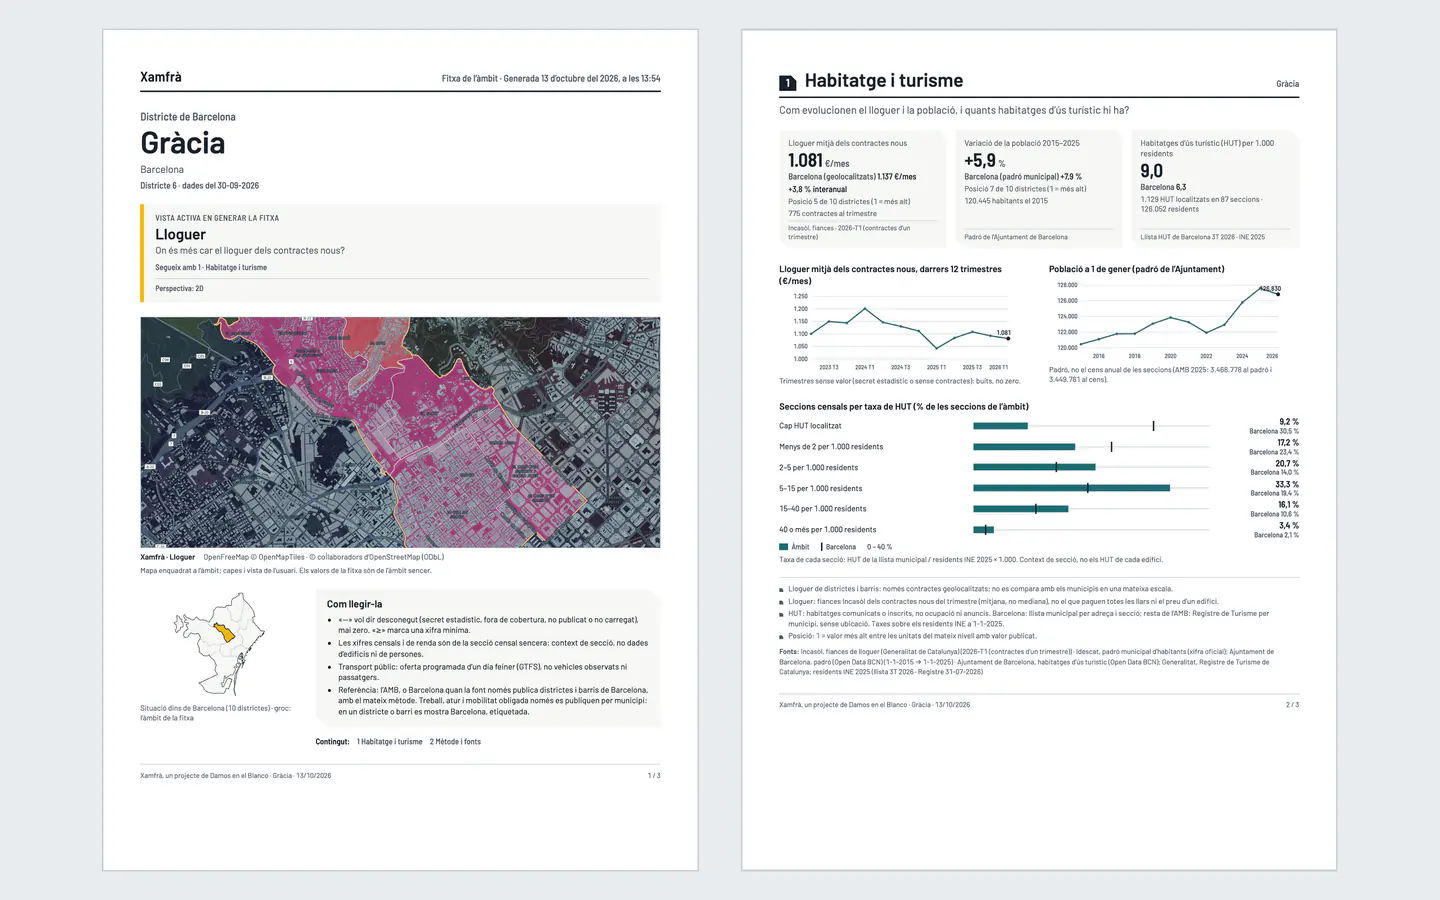
«PDF report» generates, for the chosen area, a printable report of the open view: a cover with the map framed on the area and a page of results (2 pages, plus the method and the sources), or the full report (8–13 pages). Here, the district of Gràcia with the «Lloguer» (rent) view: the figures are those of that district and every source carries its period and licence.
Rental deposits of Incasòl (Generalitat de Catalunya, 2026 Q1), Barcelona City Council register, tourist flats (Barcelona City Council and the Tourism Register of Catalonia) and INE residents (1-1-2025). Basemap: OpenFreeMap, © OpenMapTiles, OpenStreetMap contributors’ data (ODbL); Mapterhorn relief.Two new detectors with their own method: now there are eight
Flat roofs on residential buildings from before 1980 (LiDAR)
60,271 «yes» (all three conditions) out of 125,912 parcels with a known answer; 52,676 undetermined and 22,675 where it does not apply. It is not a thermal diagnosis or a project. The undetermined are 29.5 % of the 178,588 parcels where the question applies: the roof measurement does not reach every building, and in six municipalities they pass 50 %.
Floors below ground in a mapped flood zone
173 «yes» (both conditions) out of 194,164 parcels with a known answer; 7,099 undetermined. It is not a level of risk.
Published validation: association, not prediction
Buildings lower than their surroundings
Checked against Barcelona major-works licences (2022-01 to 2026-03): among the marked buildings 15.5 per 1,000 have a licence for a new building, enlargement or demolition, among the rest 6.2 (n = 53,873; Barcelona only; 45.9 % undetermined, left out of the comparison); it is an association, not a prediction. Rate ratio: 2.50 (95 % confidence interval: 1.75–3.56).
Rehabilitation: the building’s own conditions
Checked against ICAEN energy certificates (T0 31-12-2021, facts to 2026-10): among the marked buildings 38.3 per 1,000 have an energy renovation declared in a later certificate, among the rest 69.3 (n = 12,867; Metropolitan Area only; only 7.3 % of residential parcels have enough certificates at T0; the rest is not compared); the difference goes the opposite way to what was expected; it is an association, not a prediction. Rate ratio: 0.55 (95 % confidence interval: 0.46–0.67).
Industrial-zone sheds: renewal conditions
Checked against the fibre-cement roof census (ICGC, flights 2022–2023): the relationship between the marked industrial buildings and fibre cement per hectare of industrial land goes the opposite way to what was expected (Spearman ρ = −0.35, n = 185 sections with at least one detected element, Metropolitan Area only; with raw counts, which depend on section size, ρ = 0.66); it is an association between sections, not a prediction.
Deliverables, parcel sheet and comparison
Table, citation and bulletin
Download the table behind a view as CSV or GeoJSON: all 57 area and section views, with the sources and licences footer and «unknown» never as zero. «Cite this figure» copies the value with its area, period, source and licence. And there is a one-page unemployment bulletin for a municipality or for the AMB.
Search by cadastral reference or address
Type a cadastral reference or an address in the AMB and the viewer opens the parcel sheet, with the source and scope of every line: informative, not a certificate. It works for the 201,263 built parcels of the 36 municipalities.
Compare sites and choose the area
Compare 2 to 6 sites against the criteria you choose (19 available): each criterion answers yes, no or unknown and is counted «k of n», with no score. The work area can be a circle of 300, 500 or 1,000 m, or what can be reached on foot in 5, 10 or 15 min; whole sections are counted (≈).
Municipal plans and data
Municipal plans: bundles and obligations
«What you need it for» organises the work in eight bundles of municipal plans (PLH, PMUS, PAESC, DUPROCIM, POUM and three more) and says what is left to cover: of 45 topics, 18 covered, 4 partial and 23 gaps. The municipality’s obligations table says what each norm asks according to population (register of 1-1-2025): for example, twelve municipalities of 20,000 to 50,000 inhabitants must have a simplified mobility plan before 5 December 2026 (Ley 9/2025, art. 24). It does not say whether they comply.
Data with its licence in plain sight
The register holds 274 datasets and each one carries its licence: 160 with commercial use allowed, 48 with conditions, 21 for non-commercial use only, 8 to be reviewed and 37 with no declared licence. It appears in «Source and limits» and in the footer of every CSV. Three new sources have been added, still without a view in the viewer: arrivals in the municipality by census section (Idescat, 2025); the Generalitat housing block by municipality; the offer of school places for the 2026/27 course by centre (35 of 36 municipalities: Esplugues de Llobregat is not in the source).
Each criterion is stated separately and counted, never weighted; unknown is not no. When the data are not enough to decide an answer, the parcel is «undetermined» and drawn that way on the map, not as a «no». Indicative, not normative: it describes what is there, not what planning allows, and it is not a certificate or a diagnosis. Each own method carries the «Own method» seal and publishes its counts, sources and validation. Own method: count, don’t weight →
Sources: Cadastre INSPIRE (own processing), OpenStreetMap (ODbL), ICAEN, Generalitat de Catalunya, AMB, ICGC, EEA, MITECO (SNCZI), INE, Idescat and Barcelona City Council. Every figure carries its source, year and limits in the viewer; the full list is in Method and sources and, one by one, in Data.
Part of the data is for non-commercial use only or has its licence to be reviewed or declared: the viewer marks it at every source and the deliverables carry the licence.
New: detectors by building and parcel
11 October 2026. The viewer now goes down to the smallest unit: the Cadastre parcel and the building on it. The counts cover the 201,263 built parcels of the 36 municipalities; on the map, from zoom 14, each building takes the value of its parcel, and 128,338 of those parcels could be matched to an OpenStreetMap building (the rest only count in the totals). Real screenshots of the test viewer (interface in Catalan).
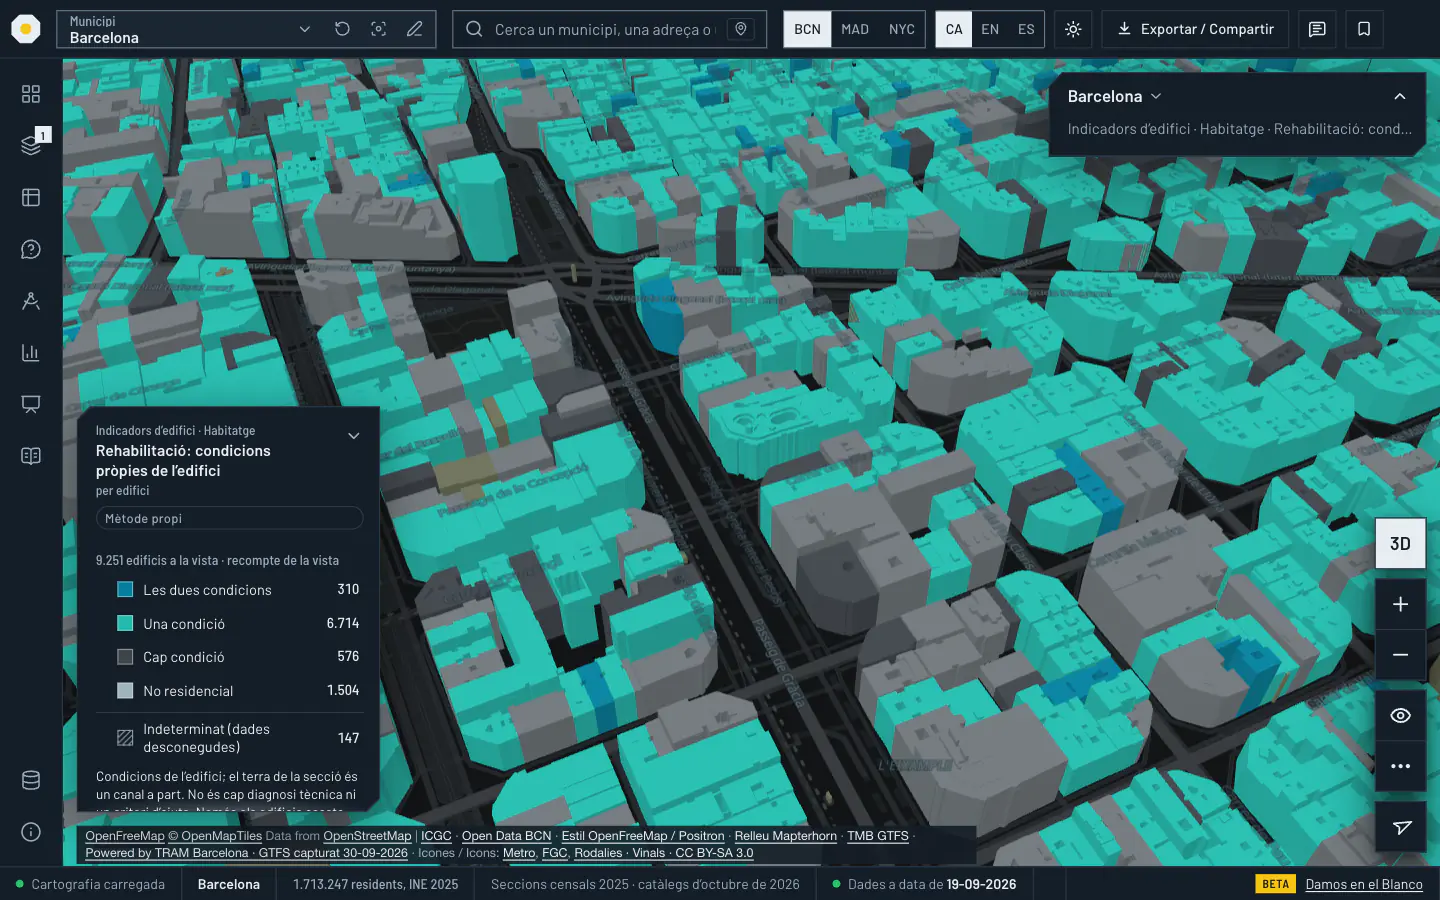
Rehabilitation: the building’s own conditions, in the Eixample of Barcelona. Each building takes the colour of its parcel’s answer; when the data are not enough to decide it, it is drawn apart as undetermined, not as «no», and the legend gives the count. It is neither a technical diagnosis nor a grant criterion.
Own method XM·R2N, with Cadastre data (INSPIRE, own processing, 2026) and other public sources. Indicative, not normative. Basemap: © OpenStreetMap contributors (ODbL) and ICGC.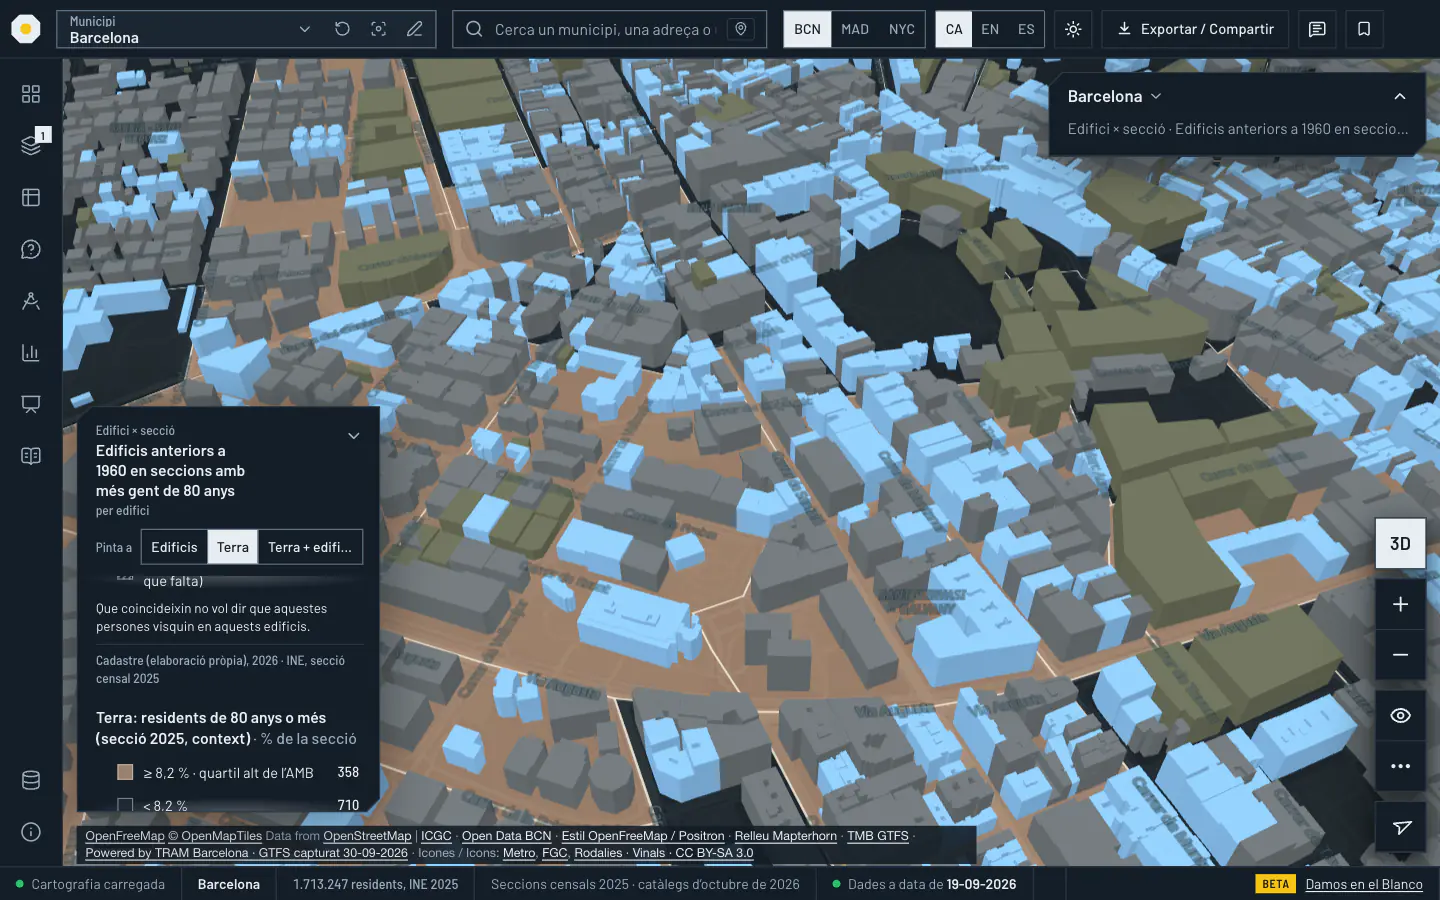
Pre-1960 buildings in sections with more people aged 80+, in Sant Gervasi. The building takes the colour of its own value (built before 1960, per the Cadastre); the ground takes that of its census section (residents aged 80+, in the AMB top quartile). That they coincide does not mean these people live in these buildings.
Cadastre (own processing, 2026) and INE, 2025 census section (1-1-2025). Basemap: © OpenStreetMap contributors (ODbL) and ICGC.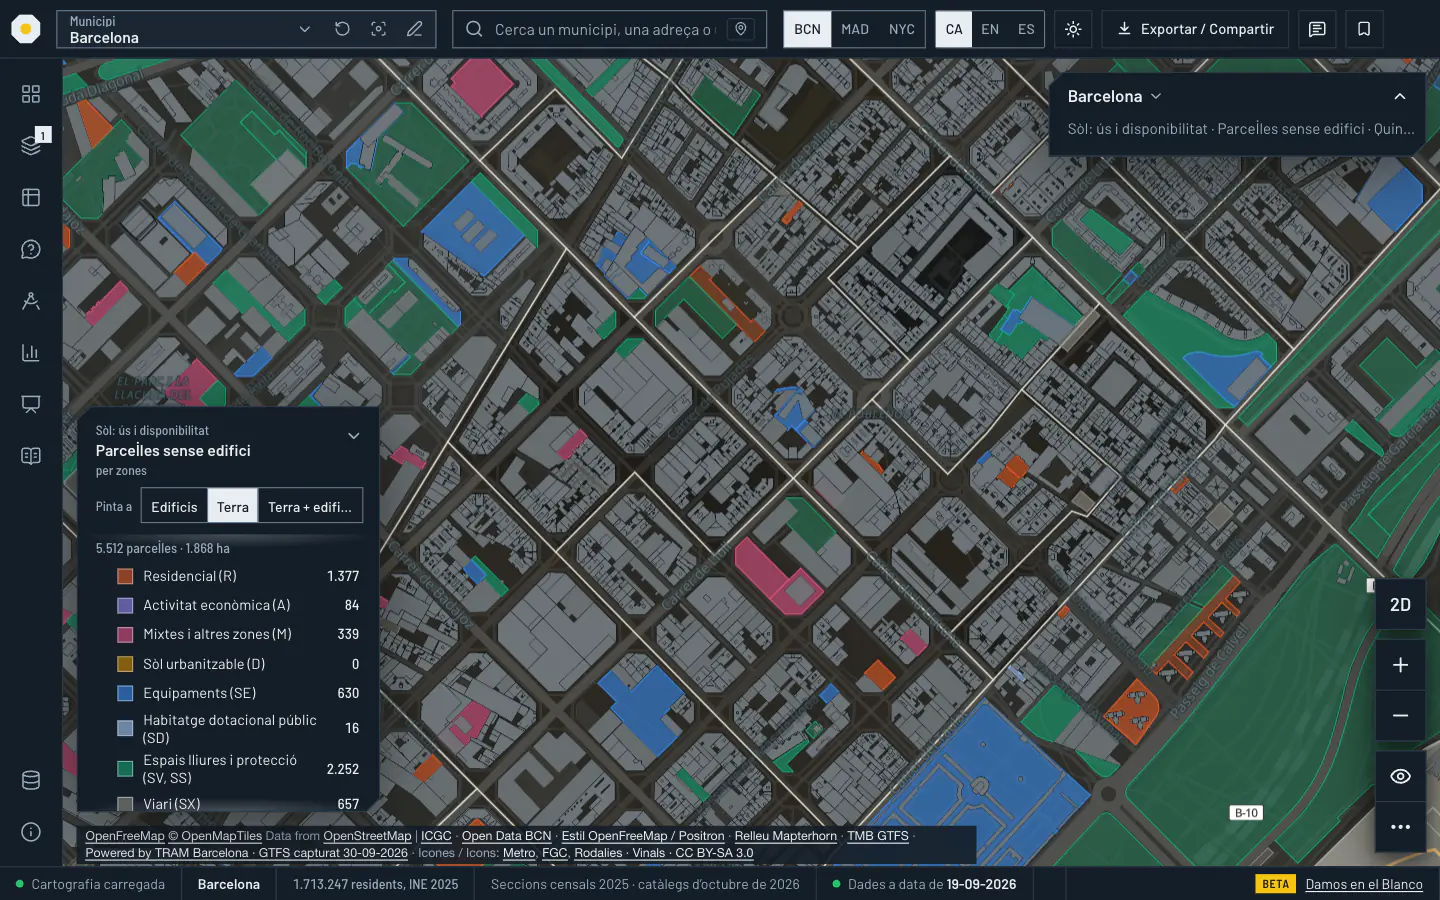
Urban parcels of 100 m² or more with no building in the Cadastre (or less than 5% built): there are 22,698 in the AMB. Here, in Poblenou, they are coloured by zoning group and can be filtered by nearby station, flood zone and size. No building does not mean it can be built on: it may be a park, a square, a car park or infrastructure.
Cadastre INSPIRE (own processing, 2026) and the urban zoning at each parcel’s interior point: planning with no normative value, not a use or a building right. Basemap: © OpenStreetMap contributors (ODbL) and ICGC.Six detectors with their own method
Buildings lower than their surroundings
5,282 «yes» (lower than their surroundings) out of 81,476 parcels with a known answer; 46,155 undetermined and 73,632 where it does not apply.
Exposures of the building
45,330 «yes» (at least one mapped exposure) out of 178,098 parcels with a known answer; 23,165 undetermined. It is not a level of risk.
Rehabilitation: the building’s own conditions
7,376 «yes» (both conditions) out of 73,232 parcels with a known answer; 103,056 undetermined and 24,975 where it does not apply.
Donor roofs
39,975 «yes» (donor roof) out of 201,263 parcels with a known answer. It is not a permit.
Activity signals at the building
27,006 «yes» (at least one signal); 174,257 undetermined (no known signal). A signal is not proof.
Industrial-zone sheds: renewal conditions
1,583 «yes» (meet the conditions) out of 7,880 parcels with a known answer; 50 undetermined and 193,333 where it does not apply.
Besides the detectors there are 14 building indicators (floors, condition, flood zone, buildings next to the forest, airport noise, heritage, urban zoning, nearest station, energy certificates, tourist flats and more) and ten «Building × section» pairs, which put a building’s value and a census section’s value on two channels that are never added. The parcel sheet, printable, gathers what the viewer knows about a building, with the scope and the source of every line and a citation for every figure.
Each criterion is stated separately and counted, never weighted; unknown is not no. When the data are not enough to decide an answer, the parcel is «undetermined» and drawn that way on the map, not as a «no»; and where there is no data (tourist flats, for example, only in Barcelona), the viewer says «unknown», never zero. Indicative, not normative: it describes what is there, not what planning allows, and it is not a certificate or a diagnosis. Own method: count, don’t weight →
Sources: Cadastre INSPIRE (own processing), OpenStreetMap (ODbL), ICAEN, Generalitat de Catalunya, AMB, ICGC, EEA, MITECO (SNCZI), Barcelona City Council and the transport operators (GTFS). Every figure carries its source, year and limits in the viewer; the full list is in Method and sources and, one by one, in Data.
New: the 3D engine and 105 more views
10 and 11 October 2026. The viewer now draws with Mapbox GL JS: façades, landmarks and trees in 3D, daytime or dusk light depending on the theme, and every building painted with the data. Since 5 October it has gone from 87 to 192 views (building-by-building indicators, planning, rehabilitation, parcels without a building, hotels, traffic, wildfires…) and from 23 to 33 planning tools, ten of them new for public transport. The whole 3D engine →
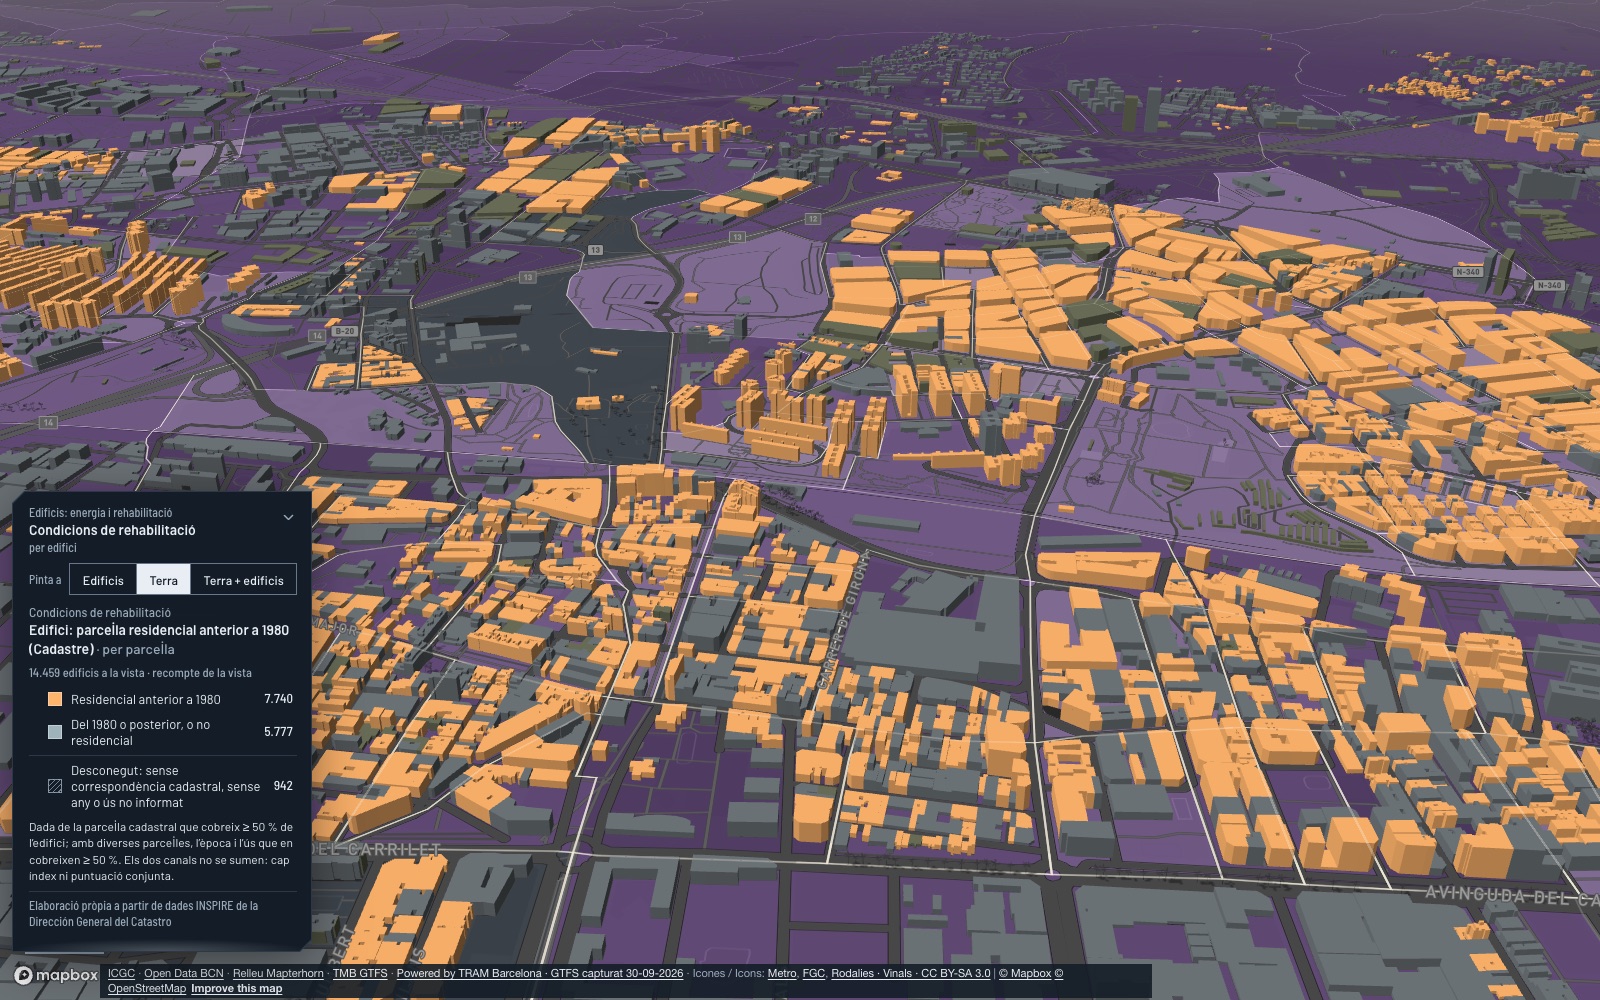
In L’Hospitalet de Llobregat, residential buildings from before 1980 according to the Cadastre; on the ground, how many energy-poverty criteria each section meets.
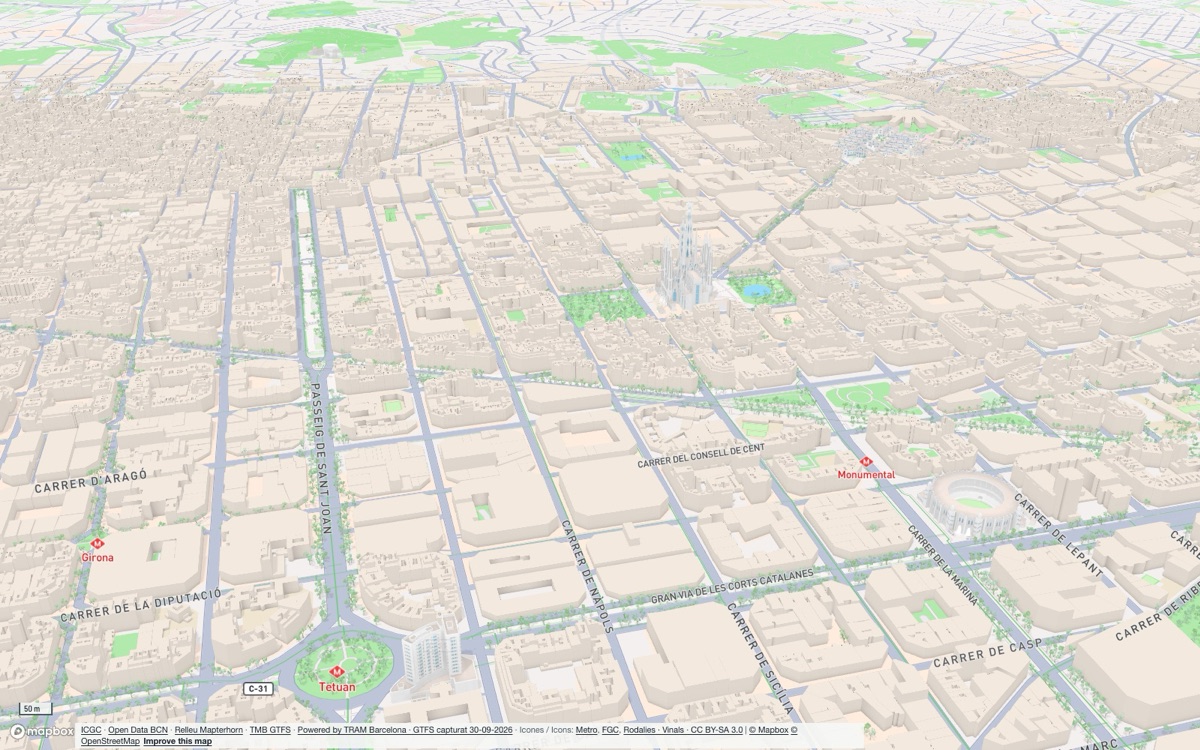
With no view open, the map helps you get your bearings: the Sagrada Família, the façades of the Eixample and the street trees.
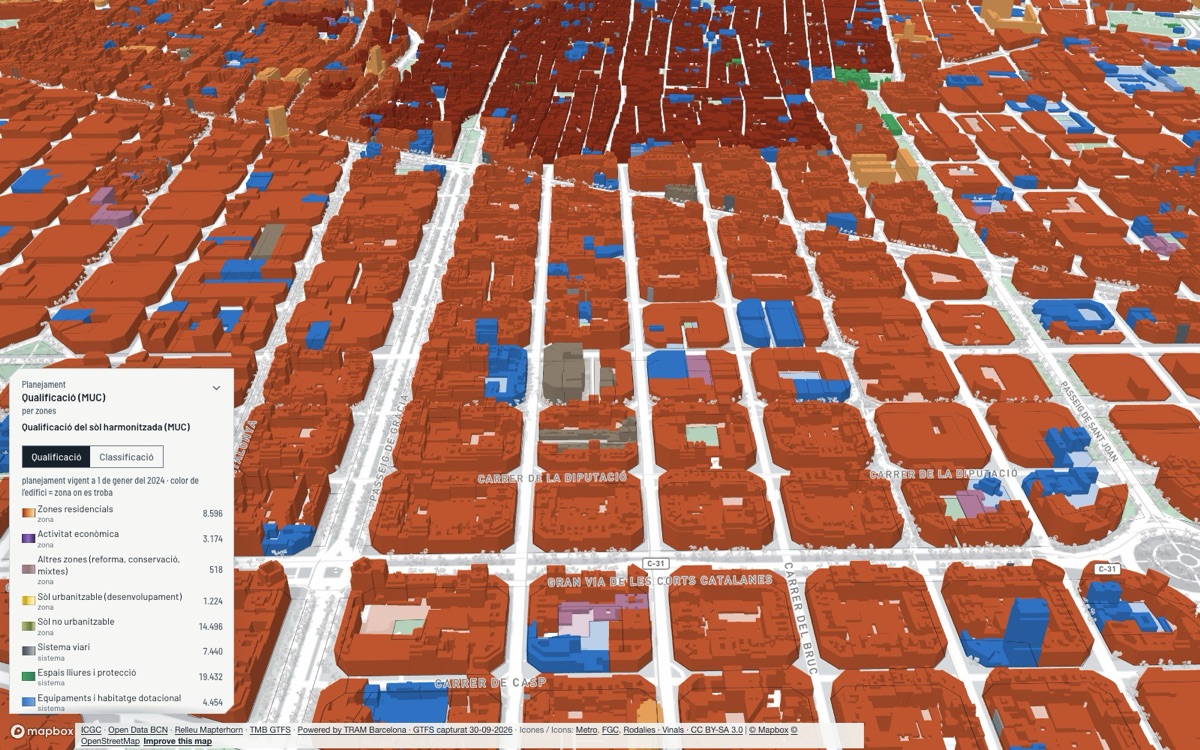
The AMB’s harmonised urban zoning (MUC) painted on each building, with the hectares of each type of land in the legend.
New: the viewer assistant
11 October 2026. Ask in Catalan, Spanish or English and the viewer answers by doing: it opens the view, paints the indicator on the map, pins places, goes to an address, compares areas and shows trends. It is a beta inside the private viewer, for registered users. Real screenshots of the test viewer (interface in Catalan).
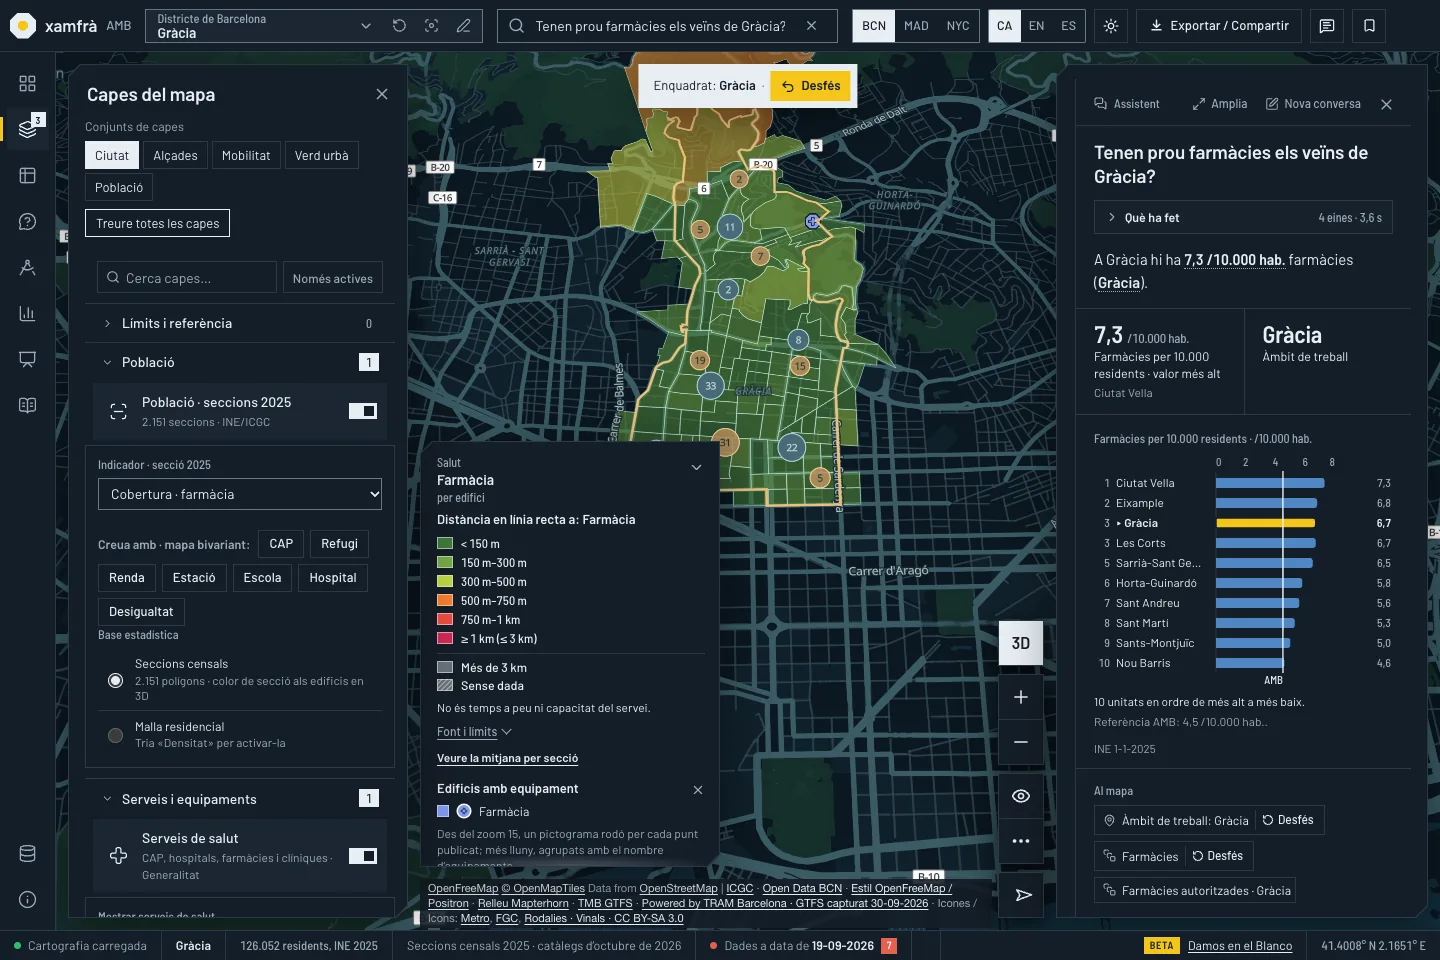
You type «Do Gràcia’s residents have enough pharmacies?» and the assistant frames Gràcia, opens the distance-to-pharmacy view and adds the chart of pharmacies per 10,000 residents by Barcelona district. Every step is listed under «What it did», with an undo, and the conversation carries on with follow-up questions. When the data is not enough, it says so instead of making something up.
The viewer’s facilities catalogue (October 2026) and INE residents (1-1-2025). Basemap: © OpenStreetMap contributors (ODbL) and ICGC. Distance is straight-line, not walking.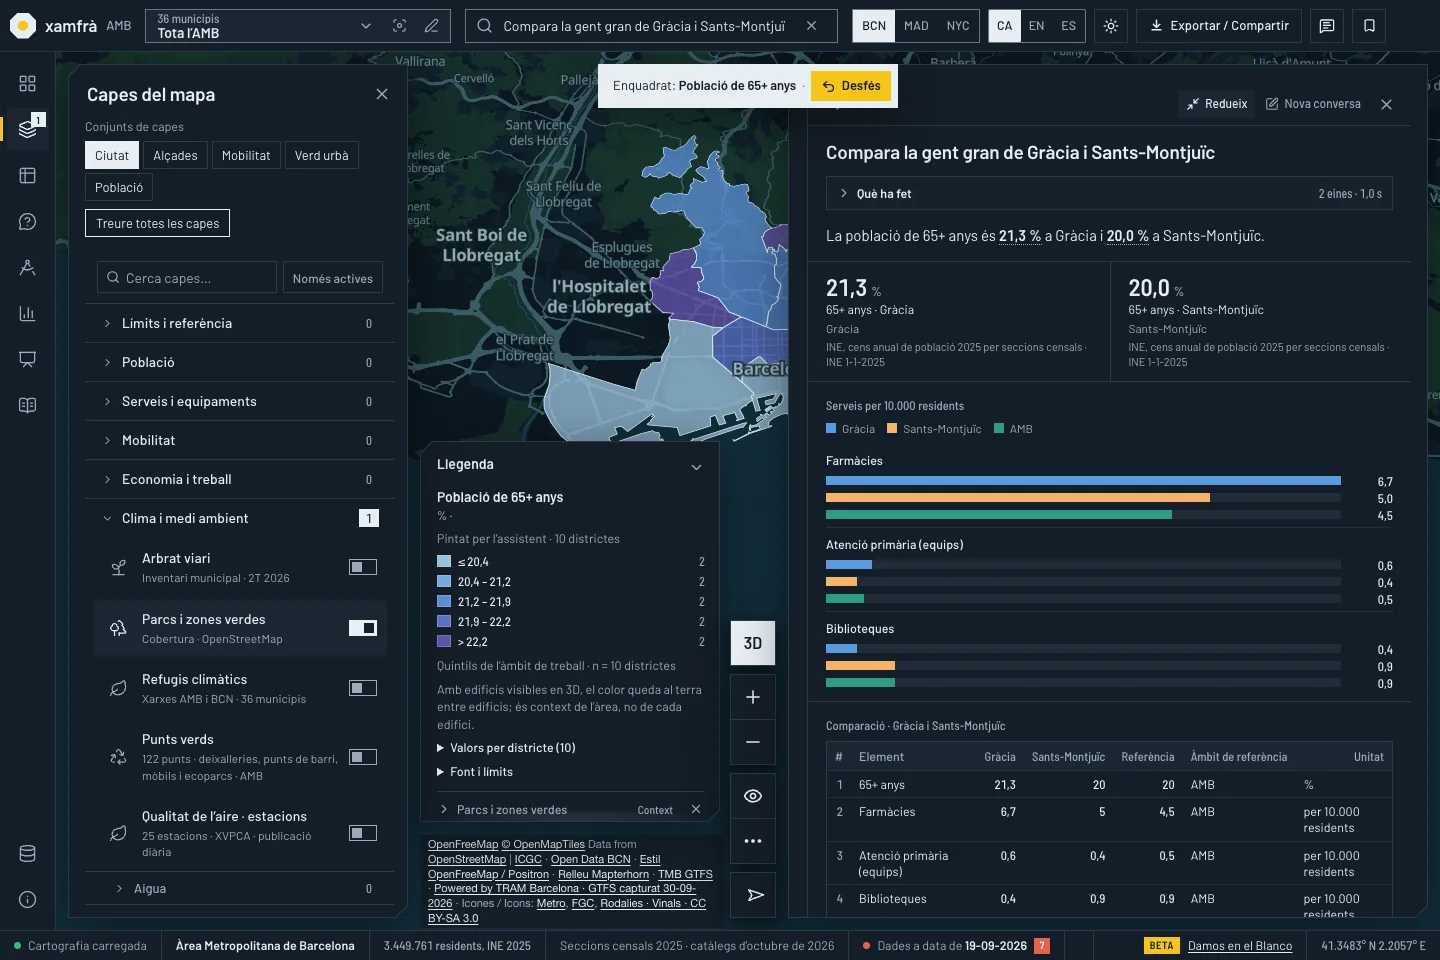
«Compare older people in Gràcia and Sants-Montjuïc» opens the comparison panel with paired bars and the full table, with the AMB reference, and paints the indicator on the districts with a quintile legend. The sentence only quotes figures the tools have calculated.
INE, annual population census 2025 by census section (1-1-2025). Basemap: © OpenStreetMap contributors (ODbL) and ICGC.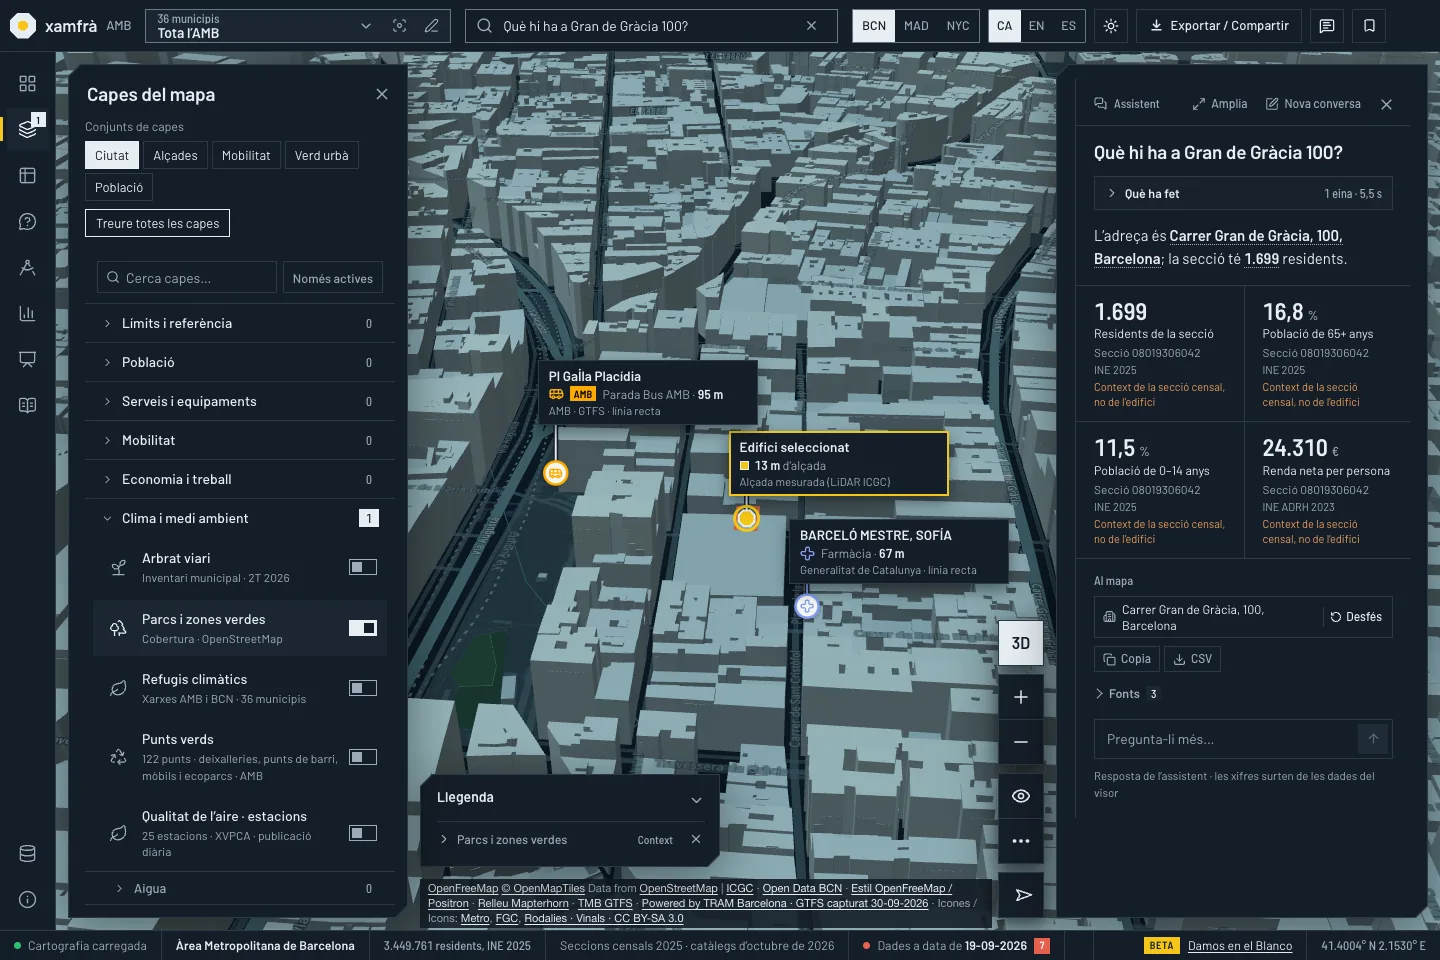
«What is at Gran de Gràcia 100?» geocodes the address, goes there, selects the building and pins the nearest bus stop and pharmacy. The card gives the residents and ages of the census section and says they are section context, not building data.
Address: CartoCiudad (IGN). Residents and age: INE, 1-1-2025; income: INE, ADRH 2023. Building heights: ICGC LiDAR. Stops: AMB GTFS. Straight-line distances.No figure is generated by an AI. The model only chooses which viewer tools to call and writes the sentence; the figures are calculated by the viewer with the same code as ever, and the server checks that every number in the answer comes from a tool or from the question. If it does not, the answer is not shown and the usual search takes over. Every answer carries its sources and what the figure does not measure. The question and the public, aggregated data it queries are sent to Anthropic’s API to write the sentence; Xamfrà does not store the questions.
Beta for registered users, only inside the viewer, with a daily limit of questions: it can be slow, fail or be unavailable, and then the usual search keeps working. In Madrid and New York the coverage is thinner than in the AMB, and the assistant does not mix cities.
What’s new in the viewer
5 October 2026. Twelve updates in four blocks: below and above the city, the city on foot, climate, water and emergencies, and population and economy. Real screenshots of the test viewer (interface in Catalan), each with its source and its limit.
Below and above the city
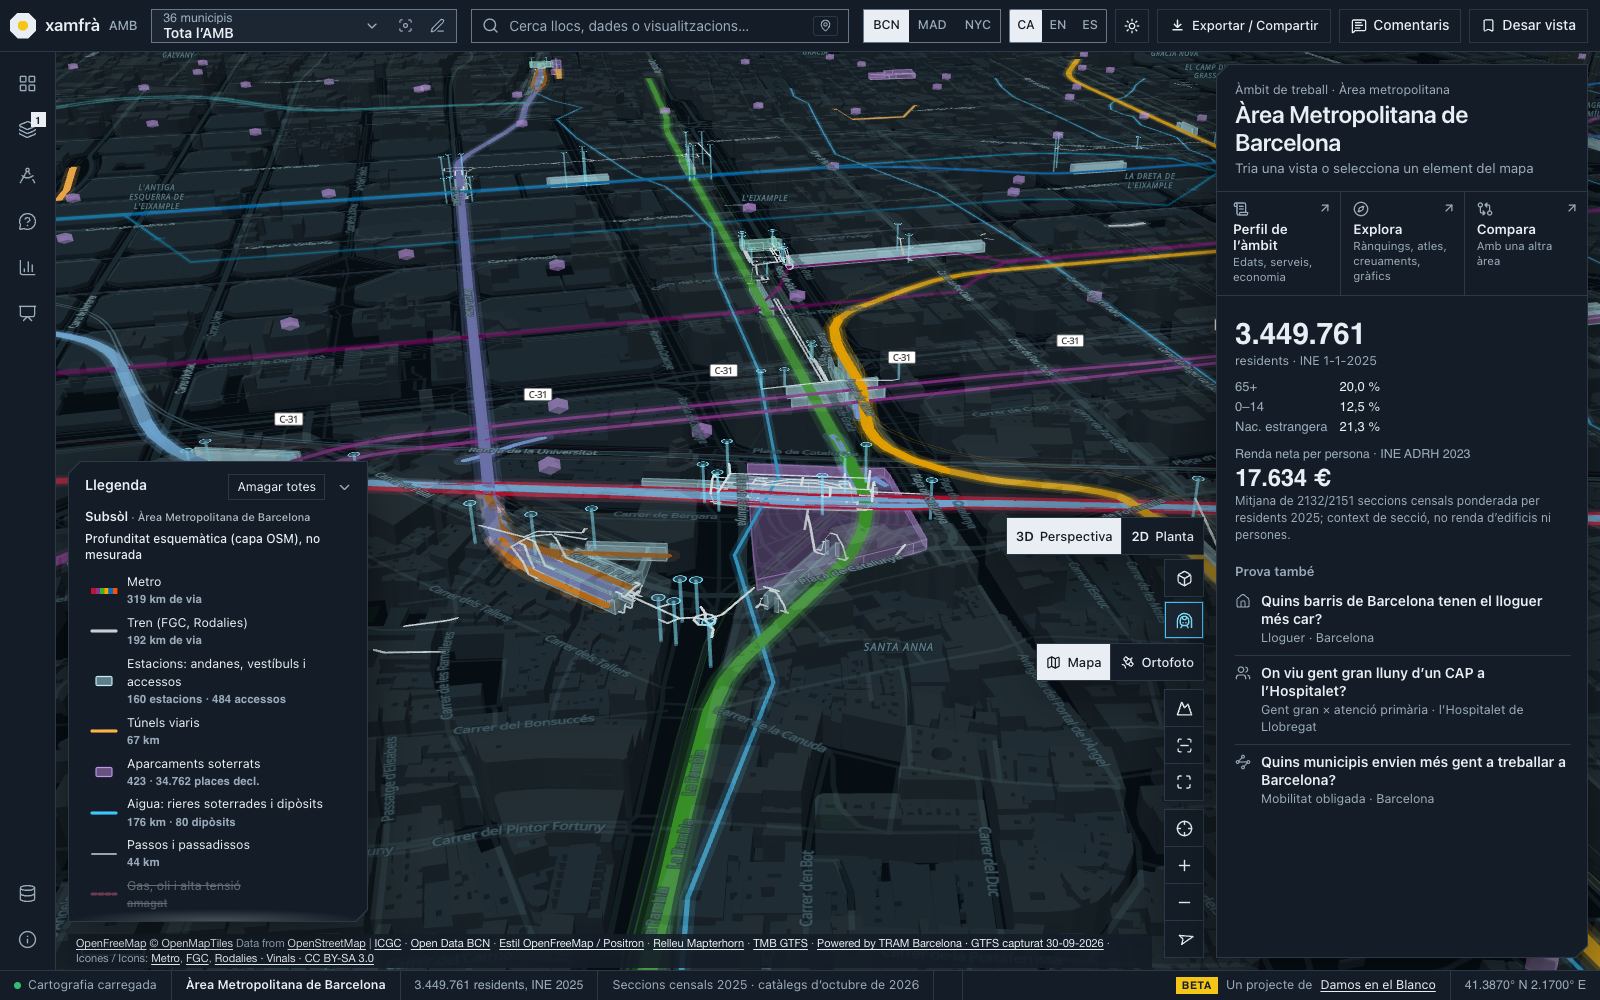
A button below «Show buildings» makes the buildings transparent and draws what lies under the street: 319 km of metro track, 192 km of rail, 67 km of road tunnels, stations with platforms and concourses, 34,762 declared spaces in 97 underground car parks and 176 km of buried streams. A click opens the card of each element.
OpenStreetMap (ODbL, 29-09-2026) and Open Data BCN rainwater tanks (CC BY 4.0). Depths are schematic, not measured; volunteered mapping is uneven (what is missing is unknown) and there is no open sewer network.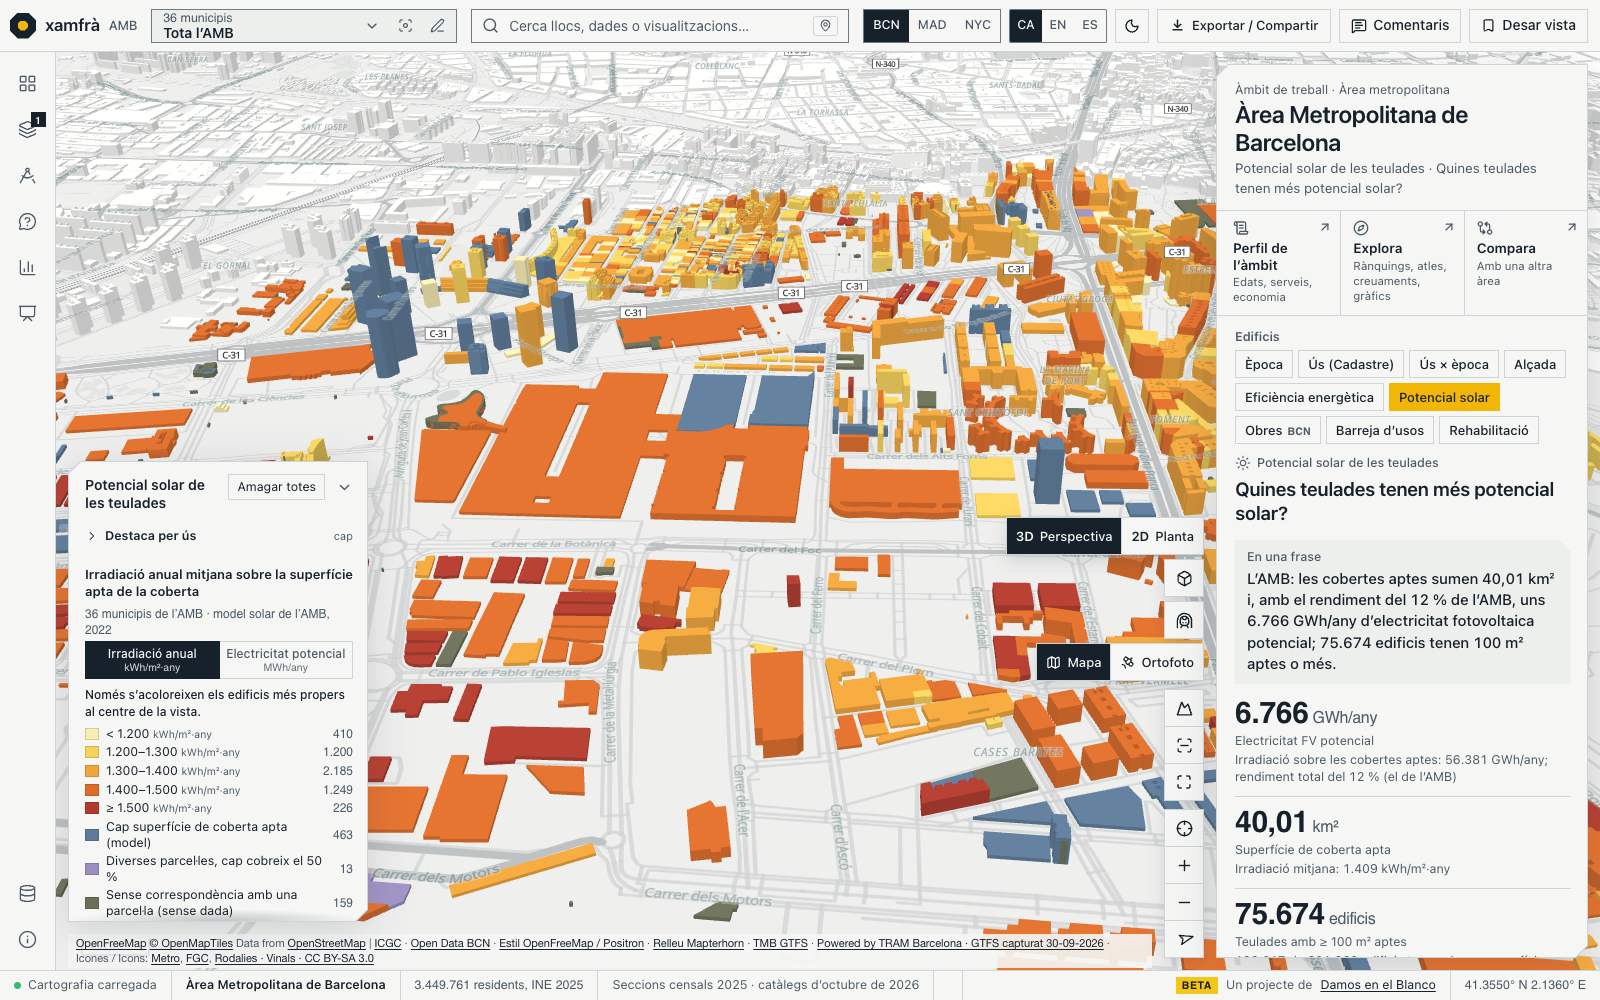
Each building takes the colour of the annual irradiation on the suitable part of its roof, or of its potential photovoltaic electricity. In the AMB, 188,017 buildings have some suitable surface: 40.01 km² which, with the 12 % yield the AMB states, would give about 6,766 GWh a year. 75,674 roofs have 100 m² or more of suitable surface.
AMB photovoltaic solar radiation model (IDEAMB, 28-09-2022, CC BY 4.0), derived product. An estimate from a 2022 model, not guaranteed output: structure, ownership, heritage and grid connection are not considered.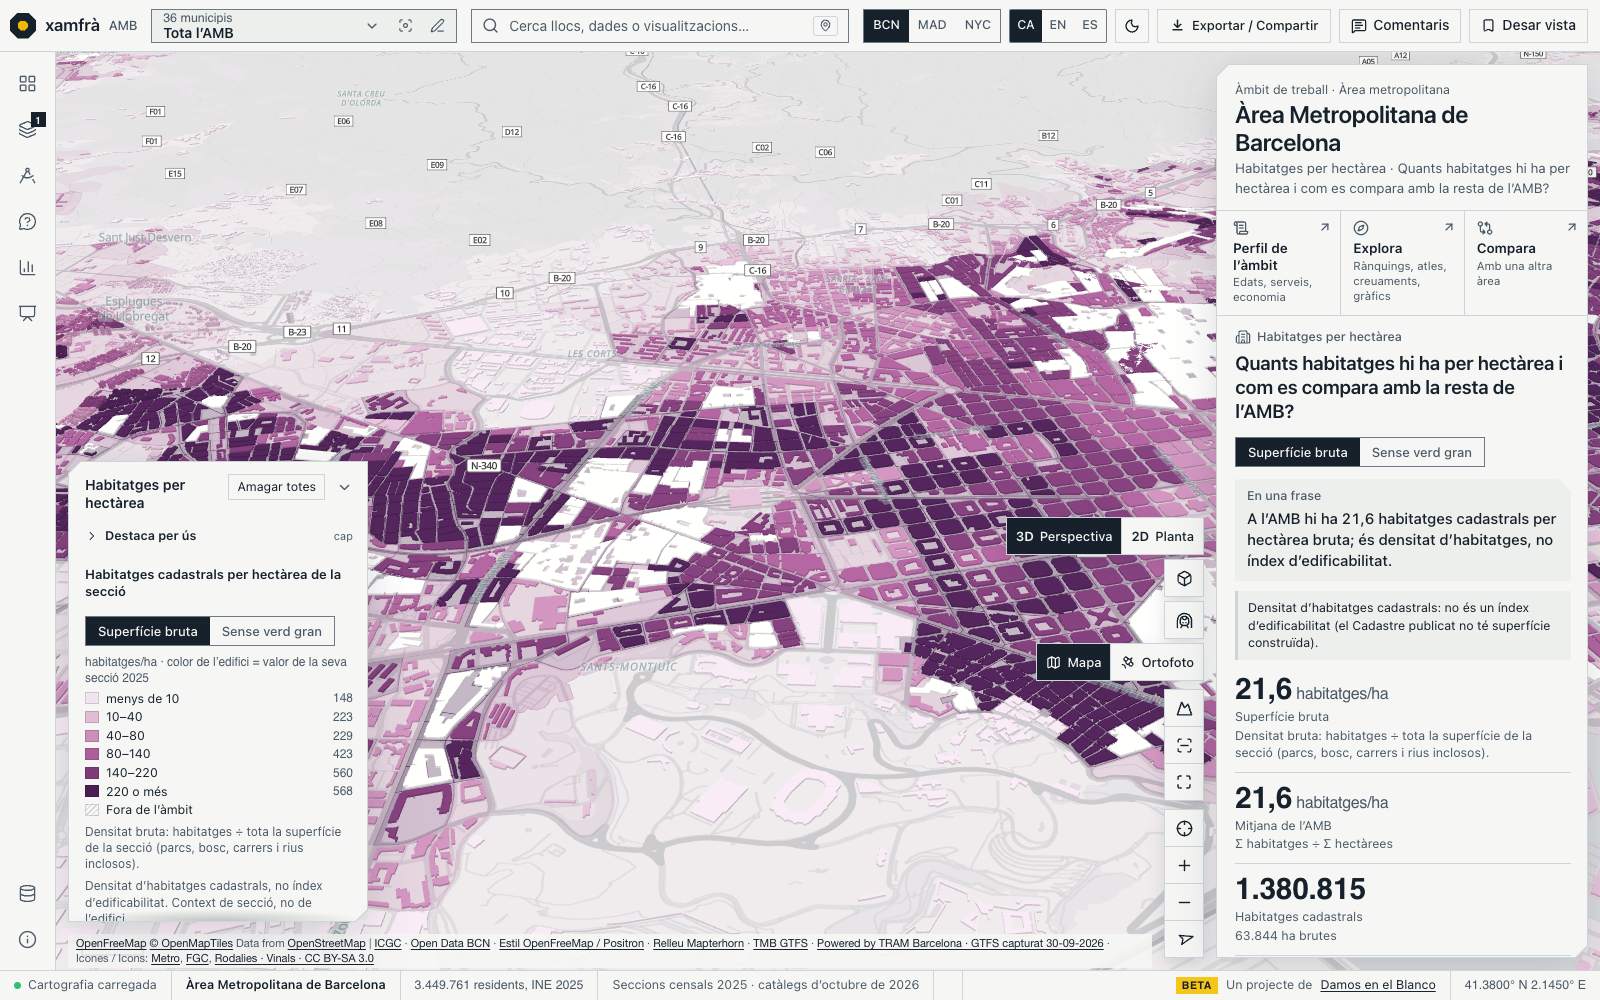
How many cadastral dwellings there are per hectare in each section, with the gross area or without large green areas. The AMB has 21.6 per gross hectare, and 31.8 without parks and woods of 2 ha or more; L’Hospitalet de Llobregat 84.4 and Barcelona 69.7.
Cadastre INSPIRE (own elaboration), 2025 census sections and OpenStreetMap (ODbL). Not a floor-area ratio: the published Cadastre has no built floor area. Empty and second homes are included; it is section context, not the building.The city on foot
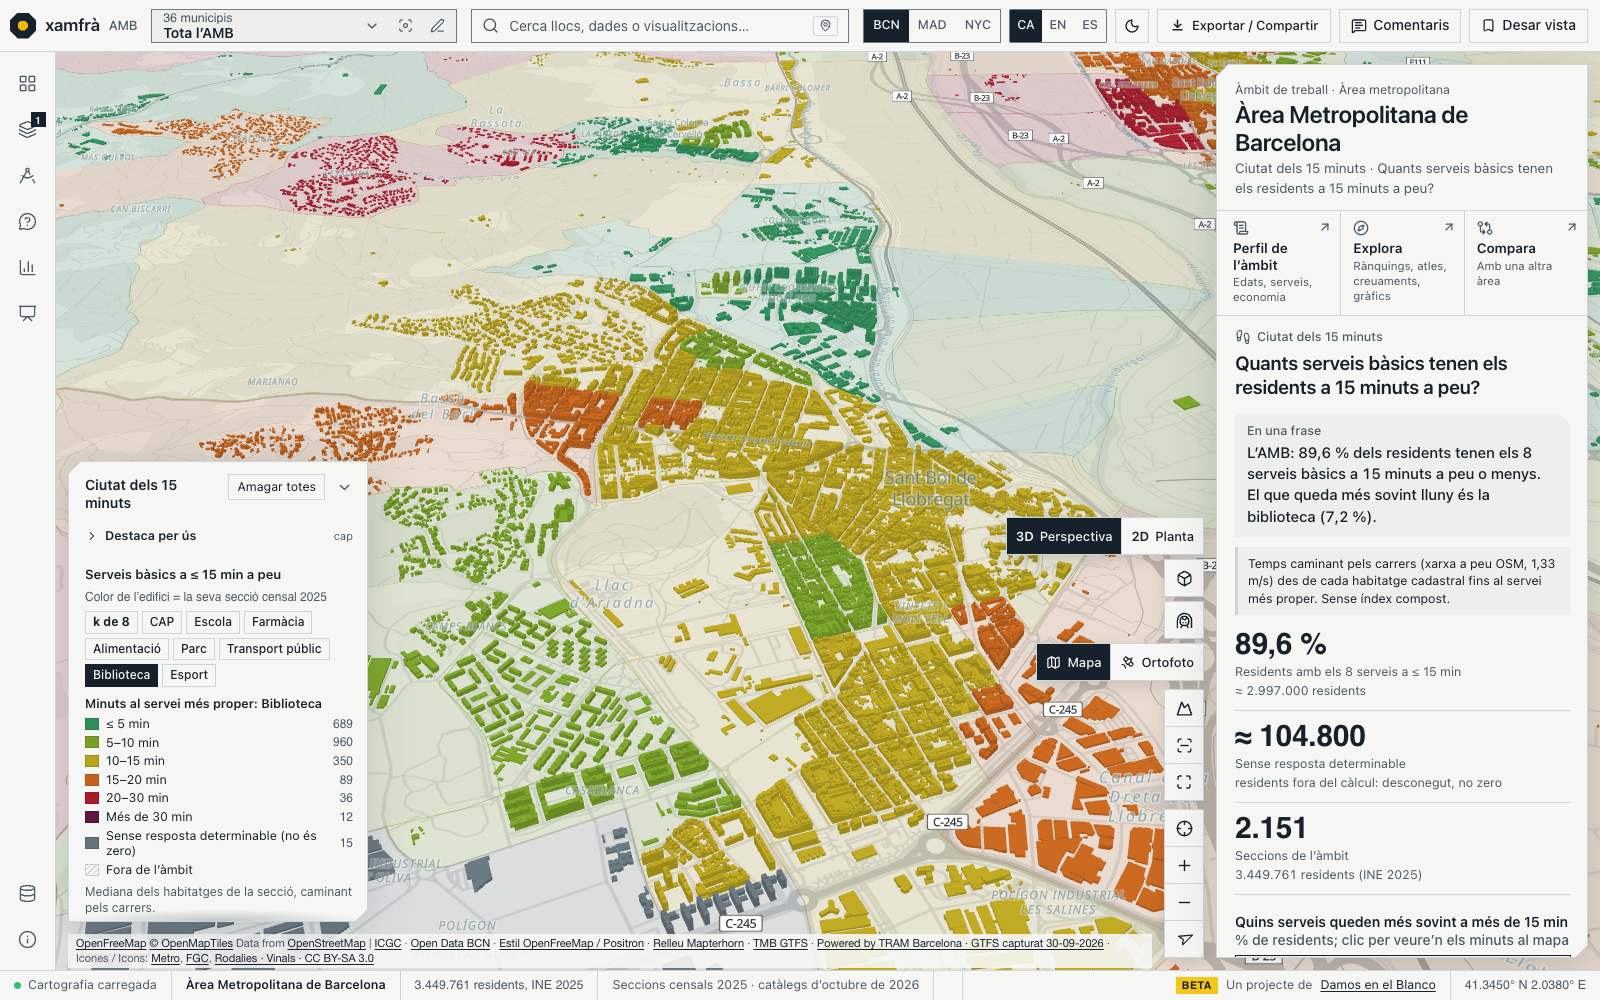
How many of eight basic services (primary care centre, primary school, pharmacy, market or supermarket, park, stop with service, library and sports facility) each section has within 15 minutes walking along the streets, from where people live. In the AMB, 89.6 % of residents with a determinable answer have all eight. In the screenshot, Sant Boi de Llobregat, where the library is what is furthest away: 16.7 % of residents need more than 15 minutes.
OpenStreetMap walking network (ODbL, 29-09-2026) at 1.33 m/s, facility catalogues, GTFS, Cadastre and INE 2025. No slopes or traffic lights; catalogue points, not entrances; civic centres not included. No composite index: services and residents (≈) are counted.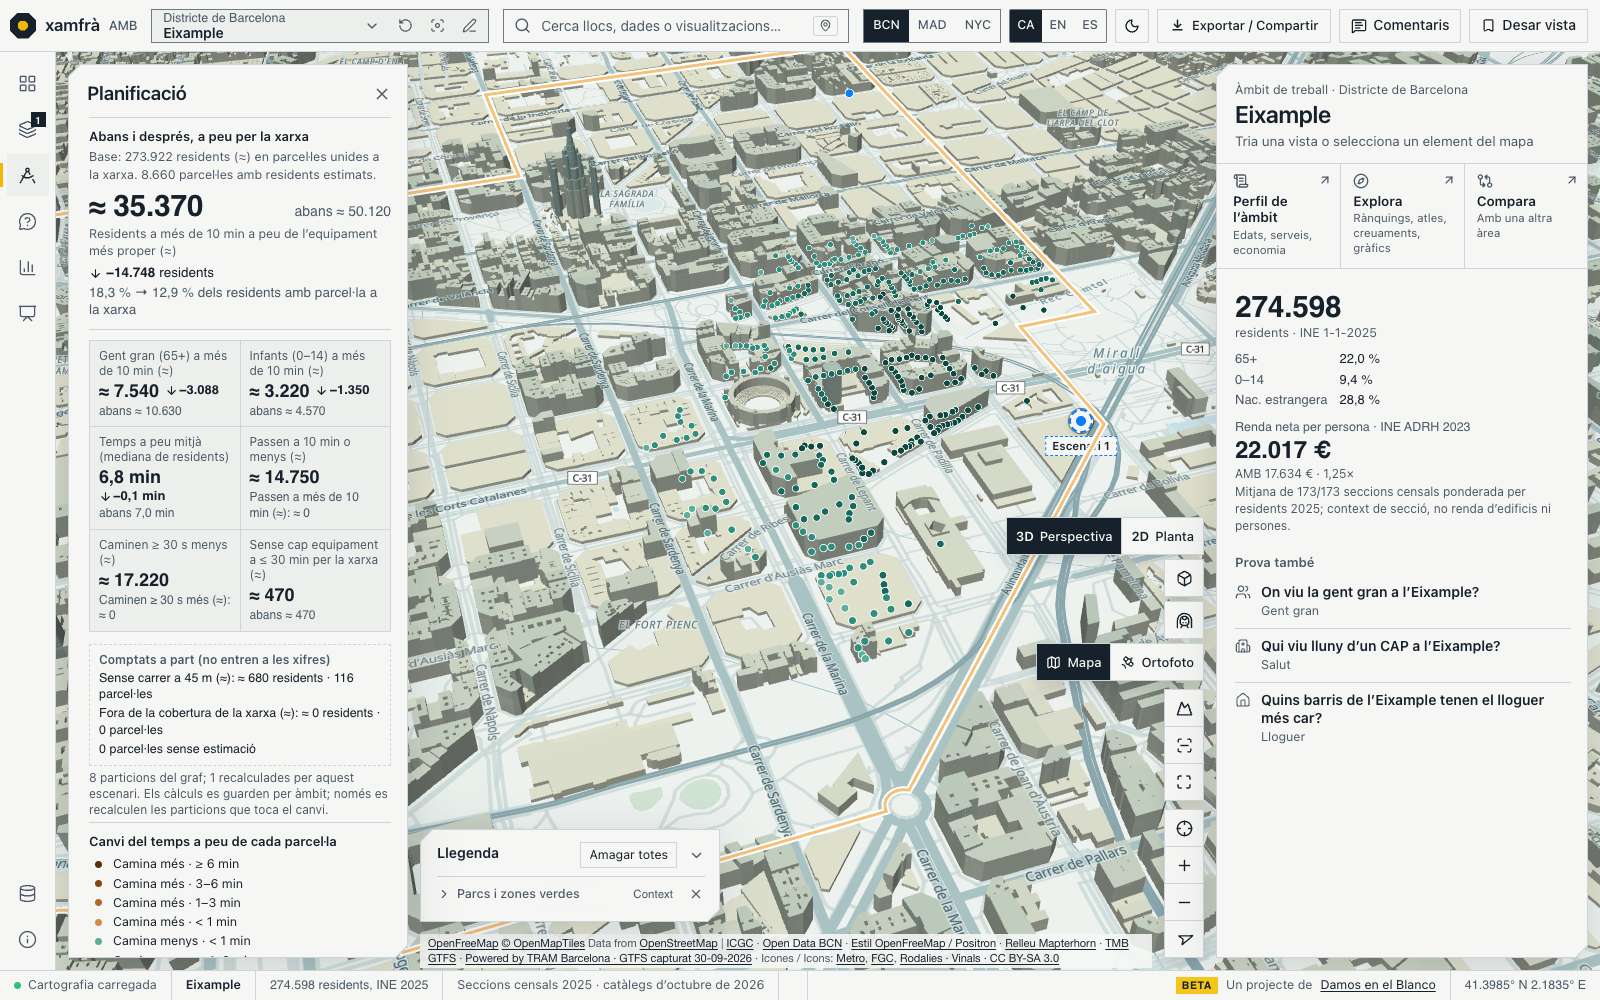
The facility simulator now counts walking minutes along the streets, not only straight-line distance, and it can also close an existing facility. In a test in the Eixample, before any change, about 50,120 residents (18.3 %) live more than 10 minutes on foot from a primary care centre; the screenshot shows what changes when one is added in the east of the district.
Illustrative scenario, not planning or capacity. OpenStreetMap walking graph (ODbL), Cadastre and INE 2025; residents allocated by dwellings (≈). No slopes, traffic lights or opening hours; AMB only.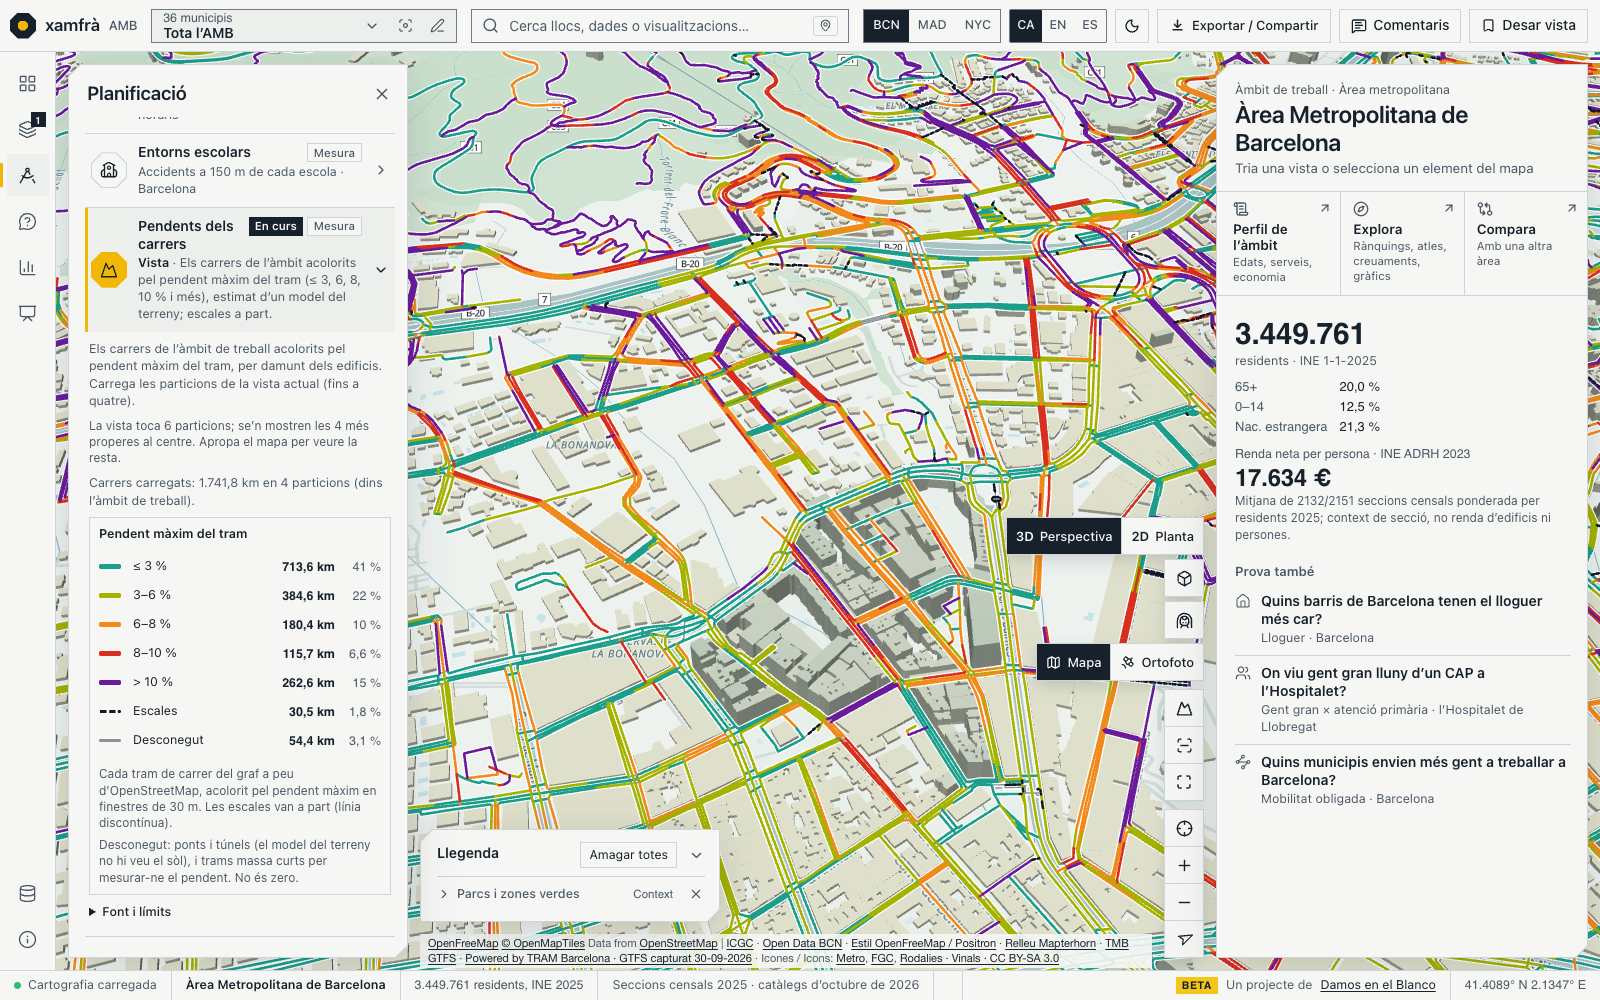
Every piece of the walking network now has an estimated grade. The «Street grades» view colours the streets by maximum grade, and the «Reduced mobility» option of the walking routes avoids steps and pieces steeper than 6, 8 or 10 %, and says how many more minutes it takes or whether the place cannot be reached.
Estimated from a digital terrain model (Mapterhorn, from CNIG MDT02 and MDT05, CC BY 4.0), with an error of 1–2 points and not validated with field measurements. It knows nothing of pavements, dropped kerbs, crossings or lifts, and it is not a compliance check. Bridges and tunnels: unknown, not flat.Climate, water and emergencies
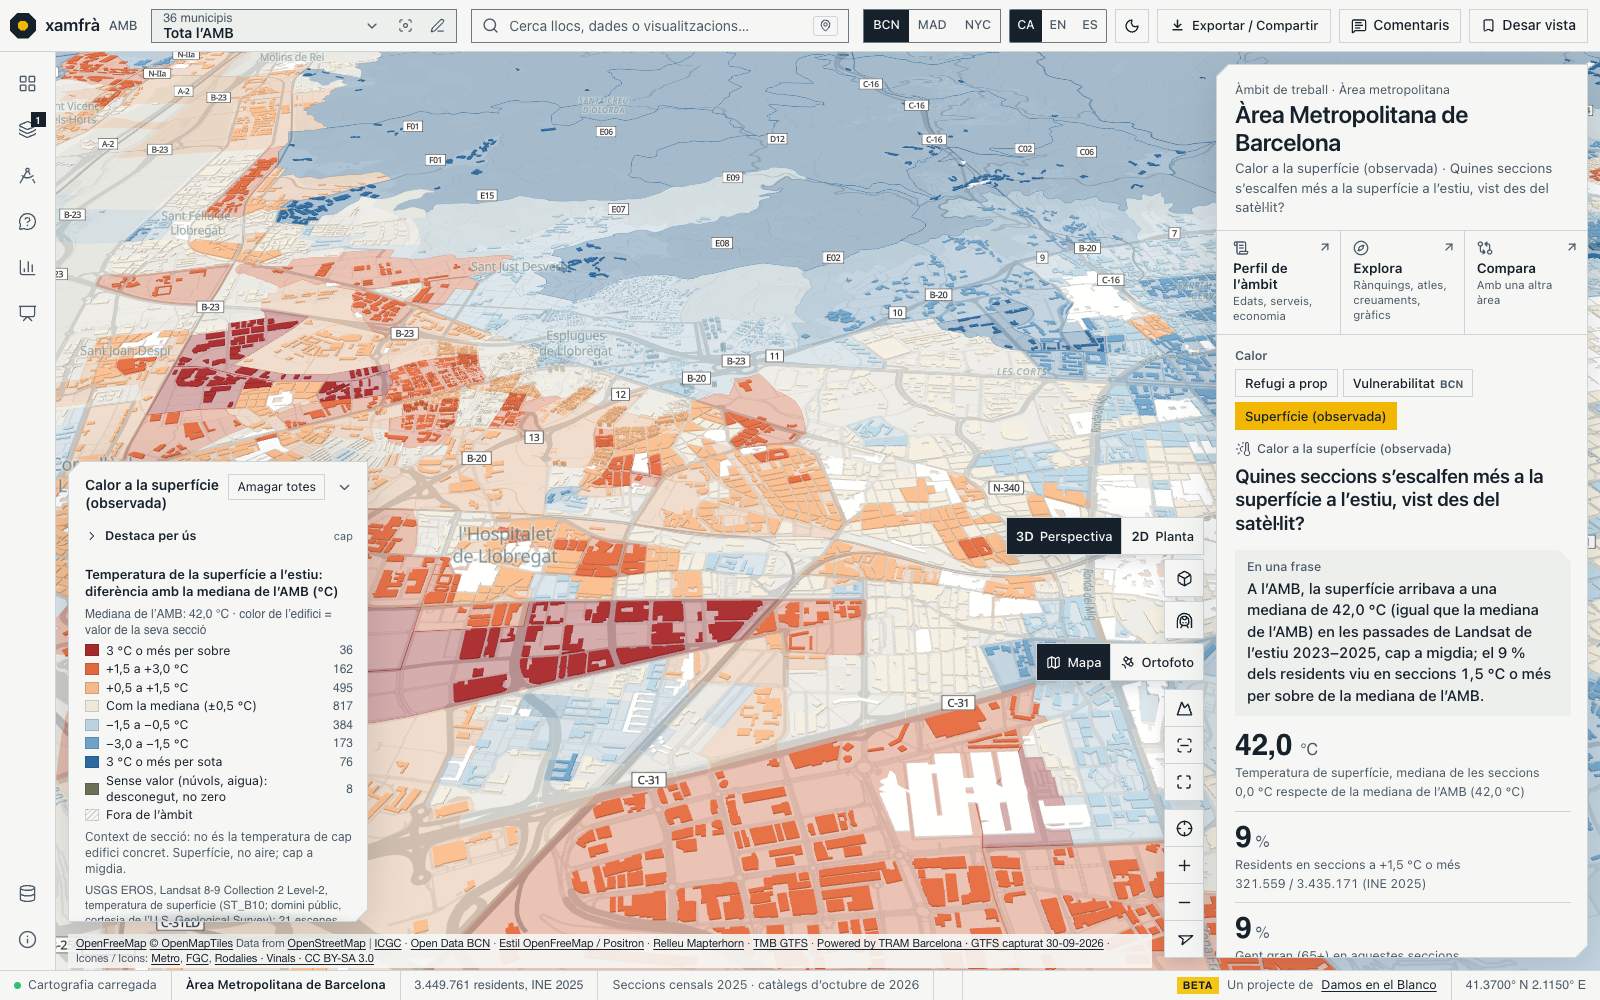
Summer surface temperature observed by the Landsat satellite, per section and across the whole AMB: the median of the clear-sky passes of July and August 2023 to 2025. The section median is 42.0 °C and the map shows the difference from it. It can be crossed with older people and with tree shade.
USGS, Landsat 8-9 Collection 2 Level-2 (public domain). It is the surface (roofs, asphalt), not the air; one pass around 12:30 and 30 m pixels. An observation, not a health or risk index; 8 sections have no value, not zero.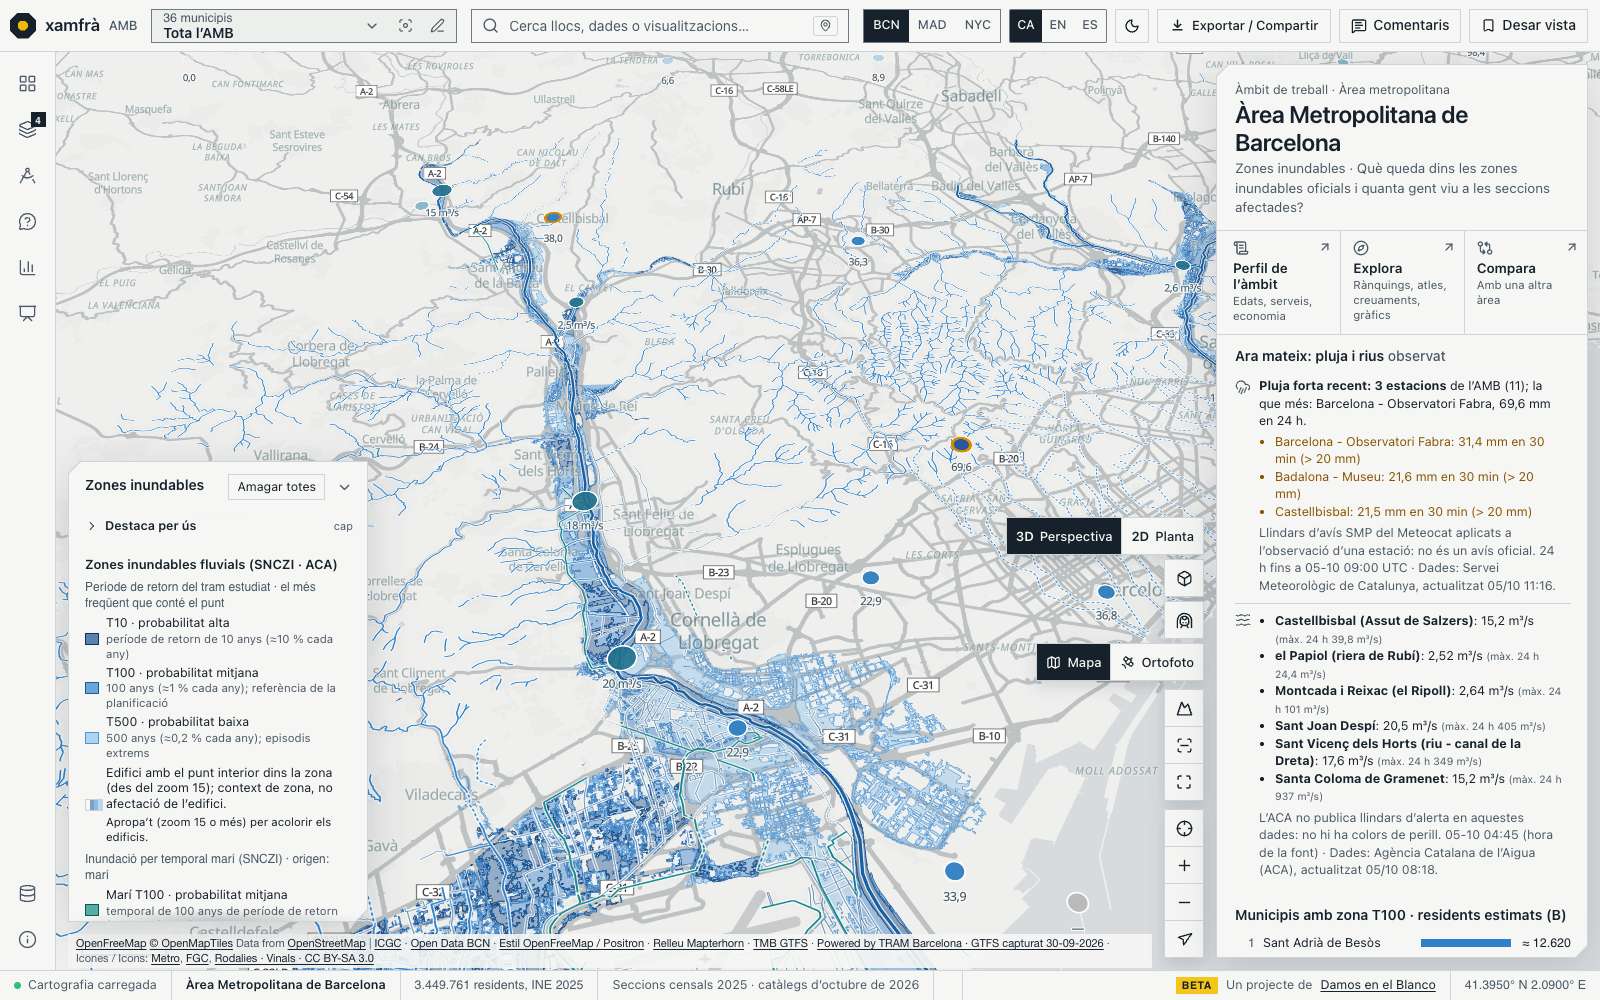
The «Flood zones» view adds observed rain at Meteocat stations and river flow at ACA gauges, with a «Right now» block, and coastal storm flood zones, kept apart from the river ones. In Barcelona, also the 13 rainwater retention tanks.
Meteocat XEMA and ACA live, with a delay (15 min to 3.5 h); SNCZI (MITECO). «Heavy rain» applies Meteocat thresholds to one station, not an official warning; the ACA publishes no alert thresholds. The coastal zone is almost all beach. Screenshot with the data of the morning of 5 October 2026.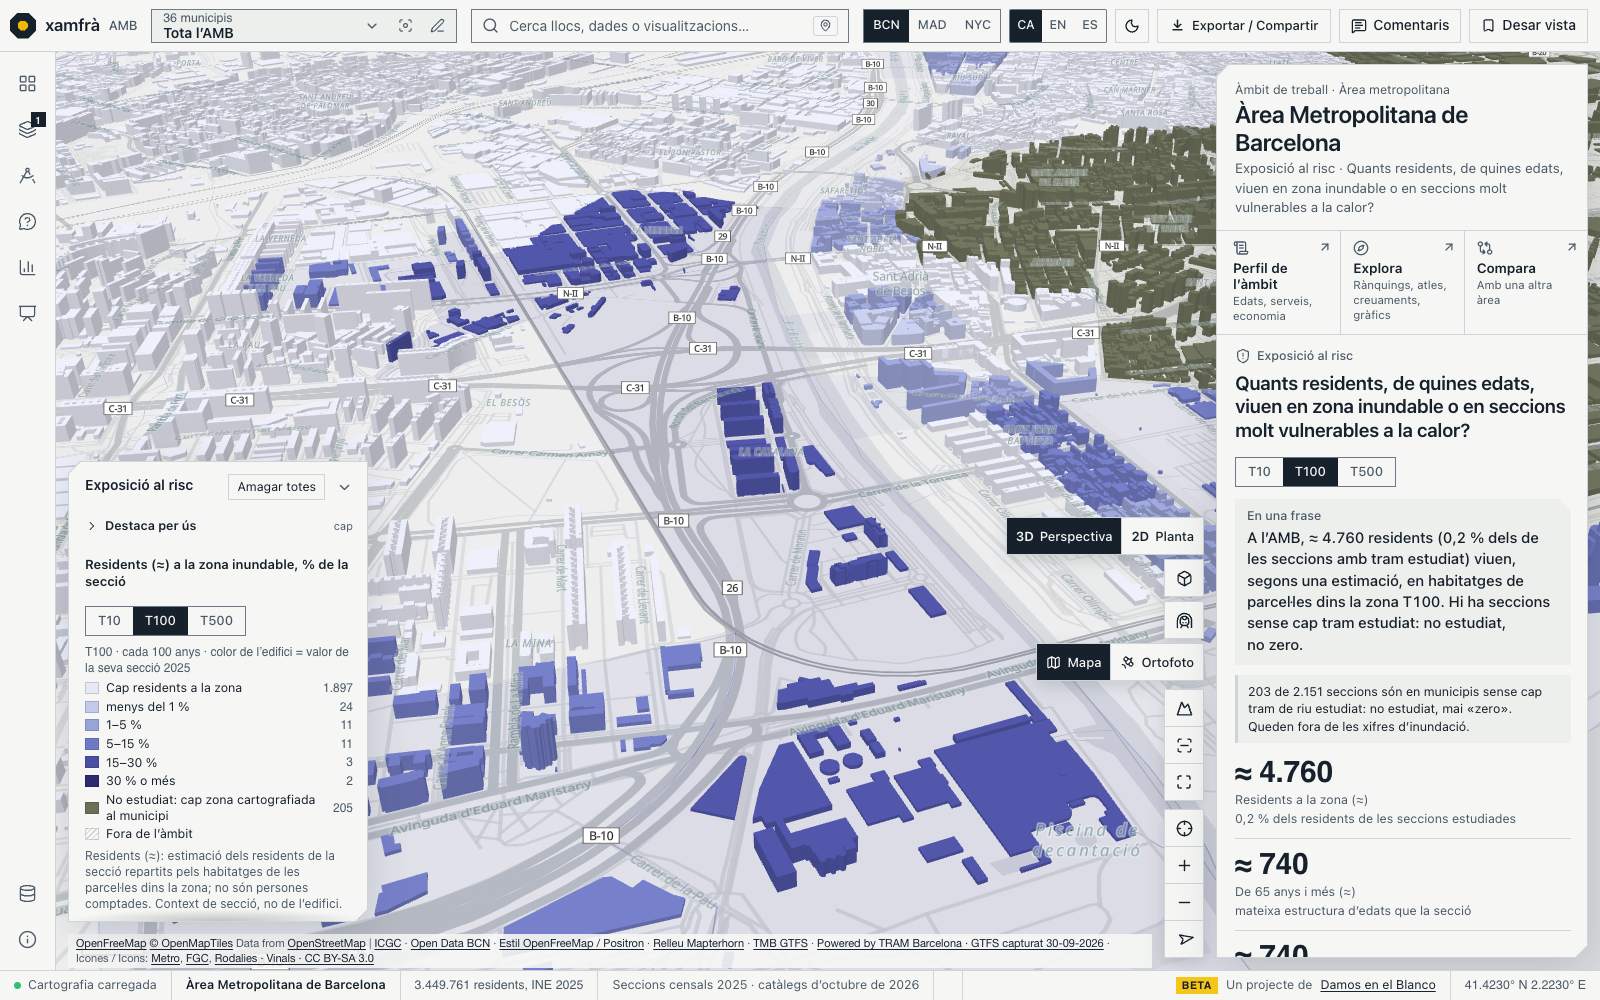
How many people live in a flood zone, and how old are they? By section and municipality, residents (≈) in dwellings inside the T10, T100 and T500 zones, with those aged 65 and over and 0 to 14. In the AMB, about 4,760 in the T100 zone. Heat is a separate row, Barcelona only: 445,880 residents in high-vulnerability sections.
SNCZI (MITECO), Cadastre and INE 2025; Barcelona City Council heat index (2015). An estimate by dwellings, not people affected, with no composite index. Studied river stretches only: 7 municipalities are «not studied», not zero; no rain or sewer flooding.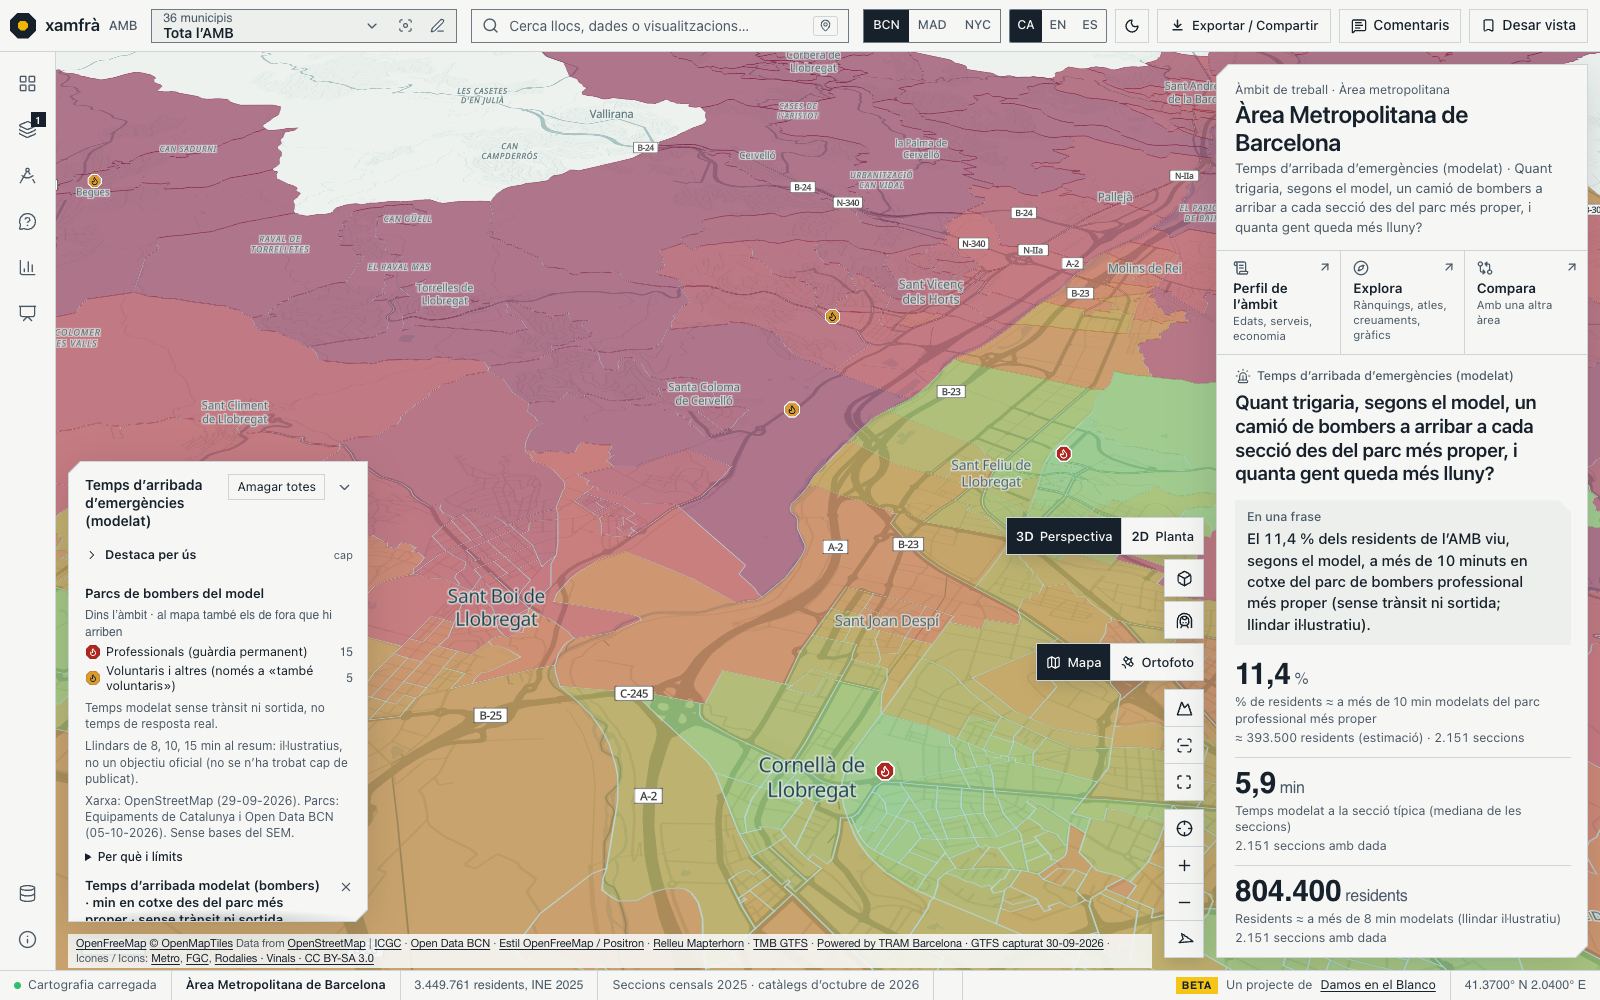
How long would a fire engine take, according to a model, from the nearest fire station to each section? In the AMB the median is 5.9 minutes and 11.4 % of residents (≈ 393,500) are more than 10 minutes away, mostly in the inner Baix Llobregat and the hills. Counting volunteer stations too, the figure drops to 8.6 %.
OpenStreetMap road network (ODbL) and stations of the Generalitat and Barcelona City Council. Modelled time with no traffic or turnout, not the real response time and not calibrated; the thresholds are illustrative. No SEM ambulance bases, which are not published.Population and economy
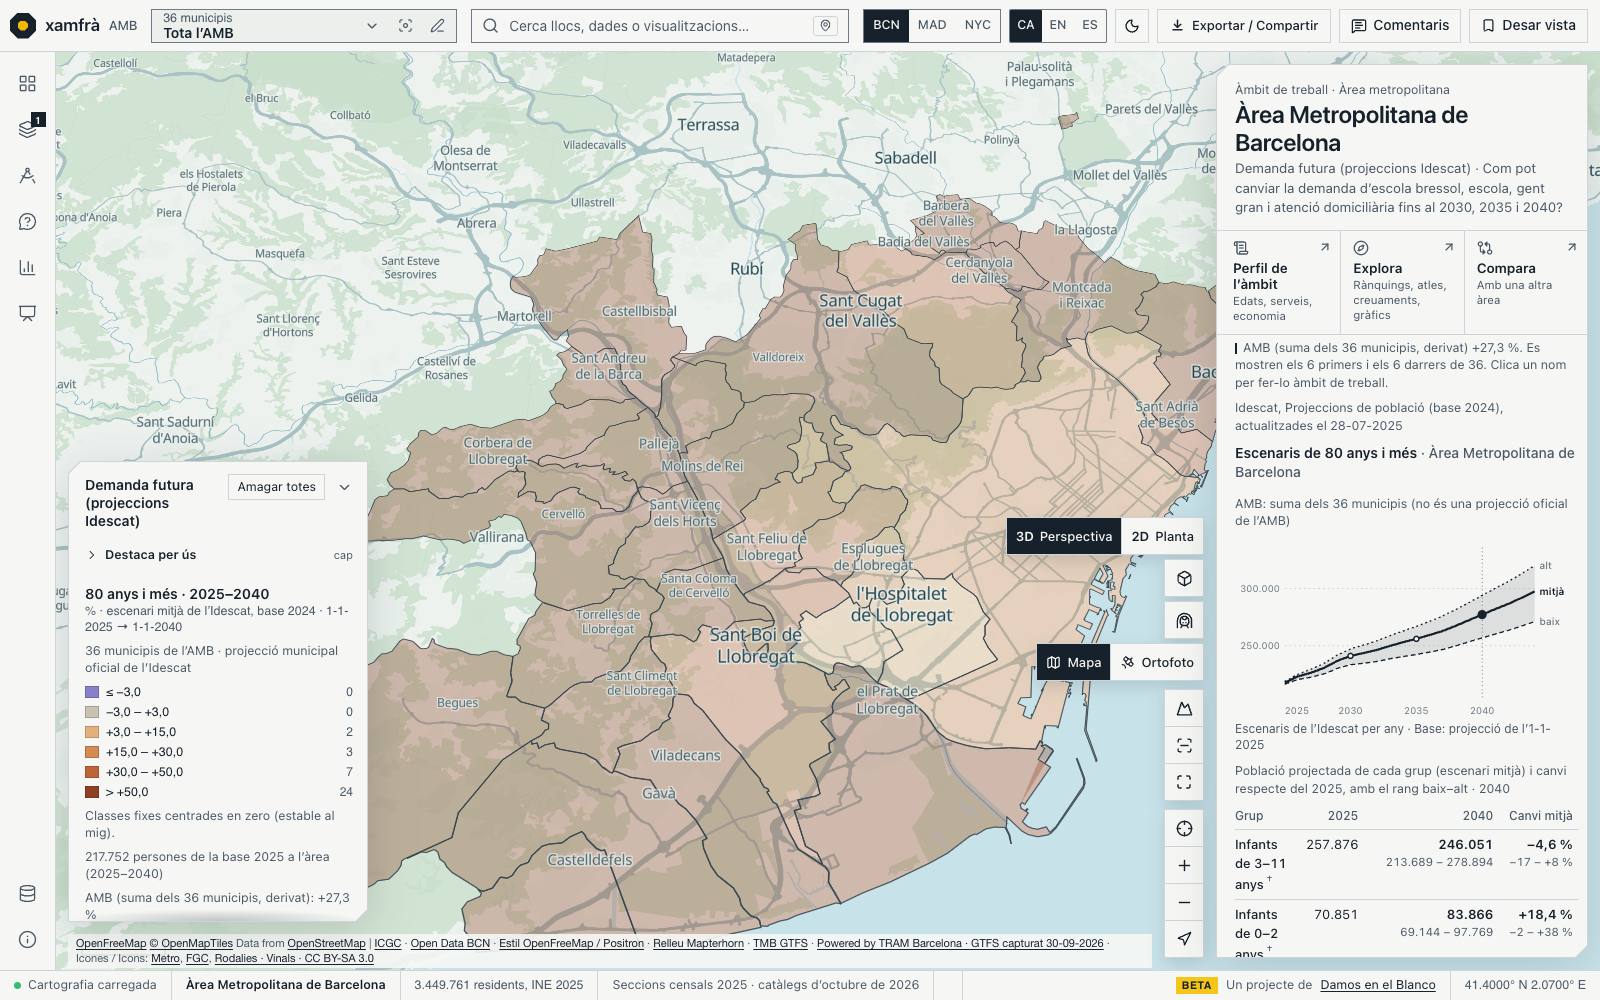
Official Idescat projections for each municipality, in three scenarios: children aged 0–2 and 3–11, people aged 65+ and 80+ and the total, in 2030, 2035 and 2040, next to today’s places. In the AMB, people aged 80 and over would grow by 27.3 % to 2040 in the medium scenario (between +18.0 and +35.0 %).
Idescat population projections (base 2024, 28 Jul 2025); residential care and school pre-enrolment places. Scenarios, not forecasts, and today’s supply is held constant. The AMB is the sum of the 36 municipalities, without districts; in 8 small municipalities the children are derived.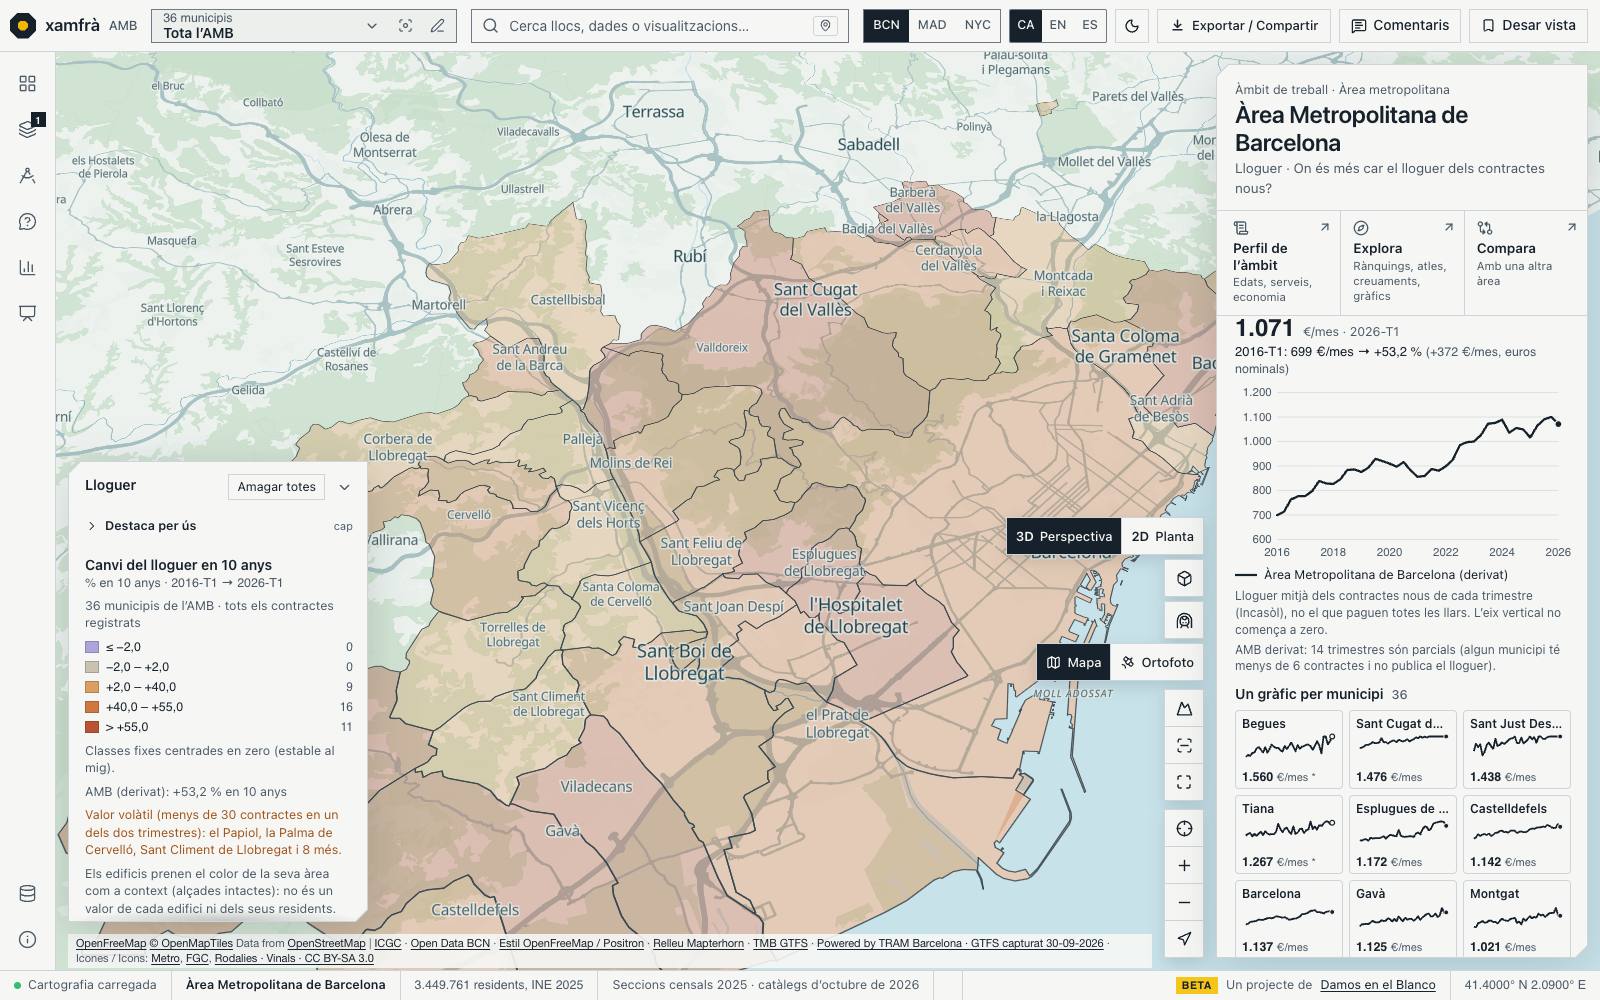
Three economic updates. The weight of knowledge-intensive sectors in each municipality’s employment (43.2 % in the AMB). The evolution of new-lease rent since 2016, with the change over 1, 3, 5 or 10 years, as in the screenshot. And the tourists from elsewhere each municipality receives every month, from the INE experimental estimate based on mobile phones.
Idescat, affiliations of June 2026; Incasòl, deposits 2016–2026; INE experimental statistics (CC BY 4.0). Knowledge: an approximation by sections, a lower bound. Rent: nominal euros of new contracts, not the whole stock. Visitors: devices, not people, and no day-trippers or visitors from the same province.Night of 4–5 October
Published on the night of 4–5 October 2026. Walking routes, through streets, live transit, building use and age, sector specialisation, European research, section types, phone-based mobility, climate and resilience, the scenario sheet, charts, imported volumes and the viewer in Spanish. Real screenshots of the test viewer (interface in Catalan), each with its source and its limit.
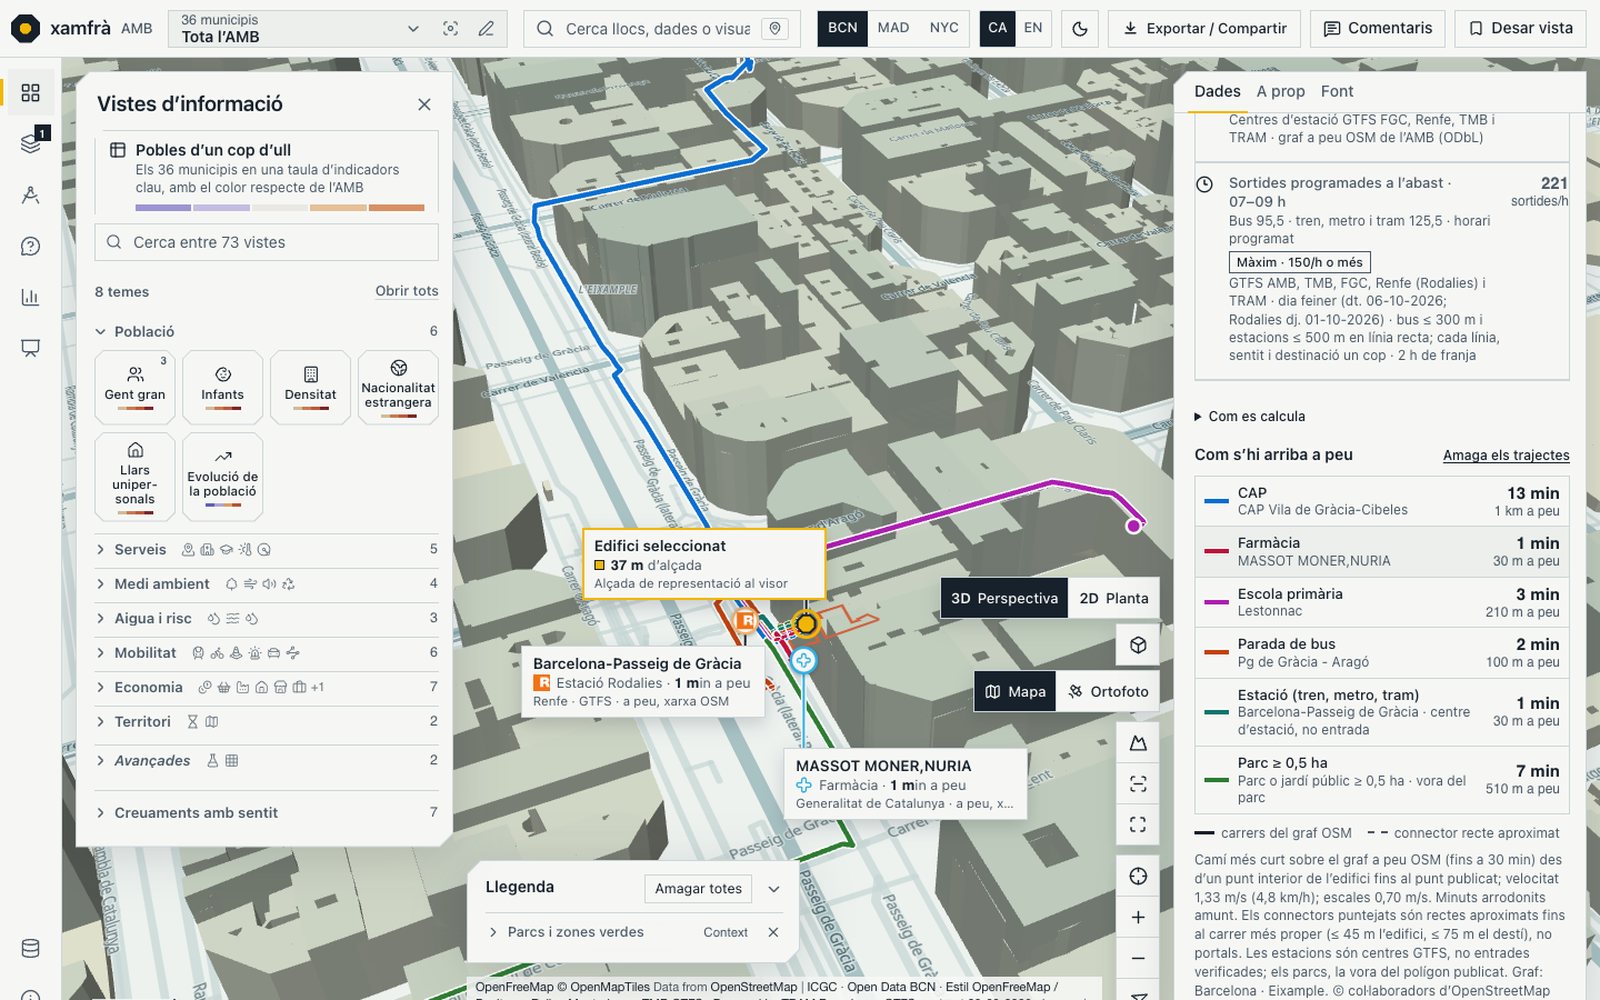
Select a building and “How to get there on foot” draws, over the streets, the shortest path to the nearest CAP (primary care centre), pharmacy, primary school, bus stop, station and park, with the minutes. “Transit here” breaks down the nearest stop and station and their scheduled departures per hour. It is computed on request, and outside the walking graph’s coverage it says so instead of drawing a straight line.
OpenStreetMap walking graph (ODbL, Geofabrik, 29-09-2026), up to 30 min at 4.8 km/h. Stations are GTFS centres, not entrances; the links to the doorway are straight and approximate; no slopes or traffic lights. Departures are the scheduled supply for a weekday, not live service.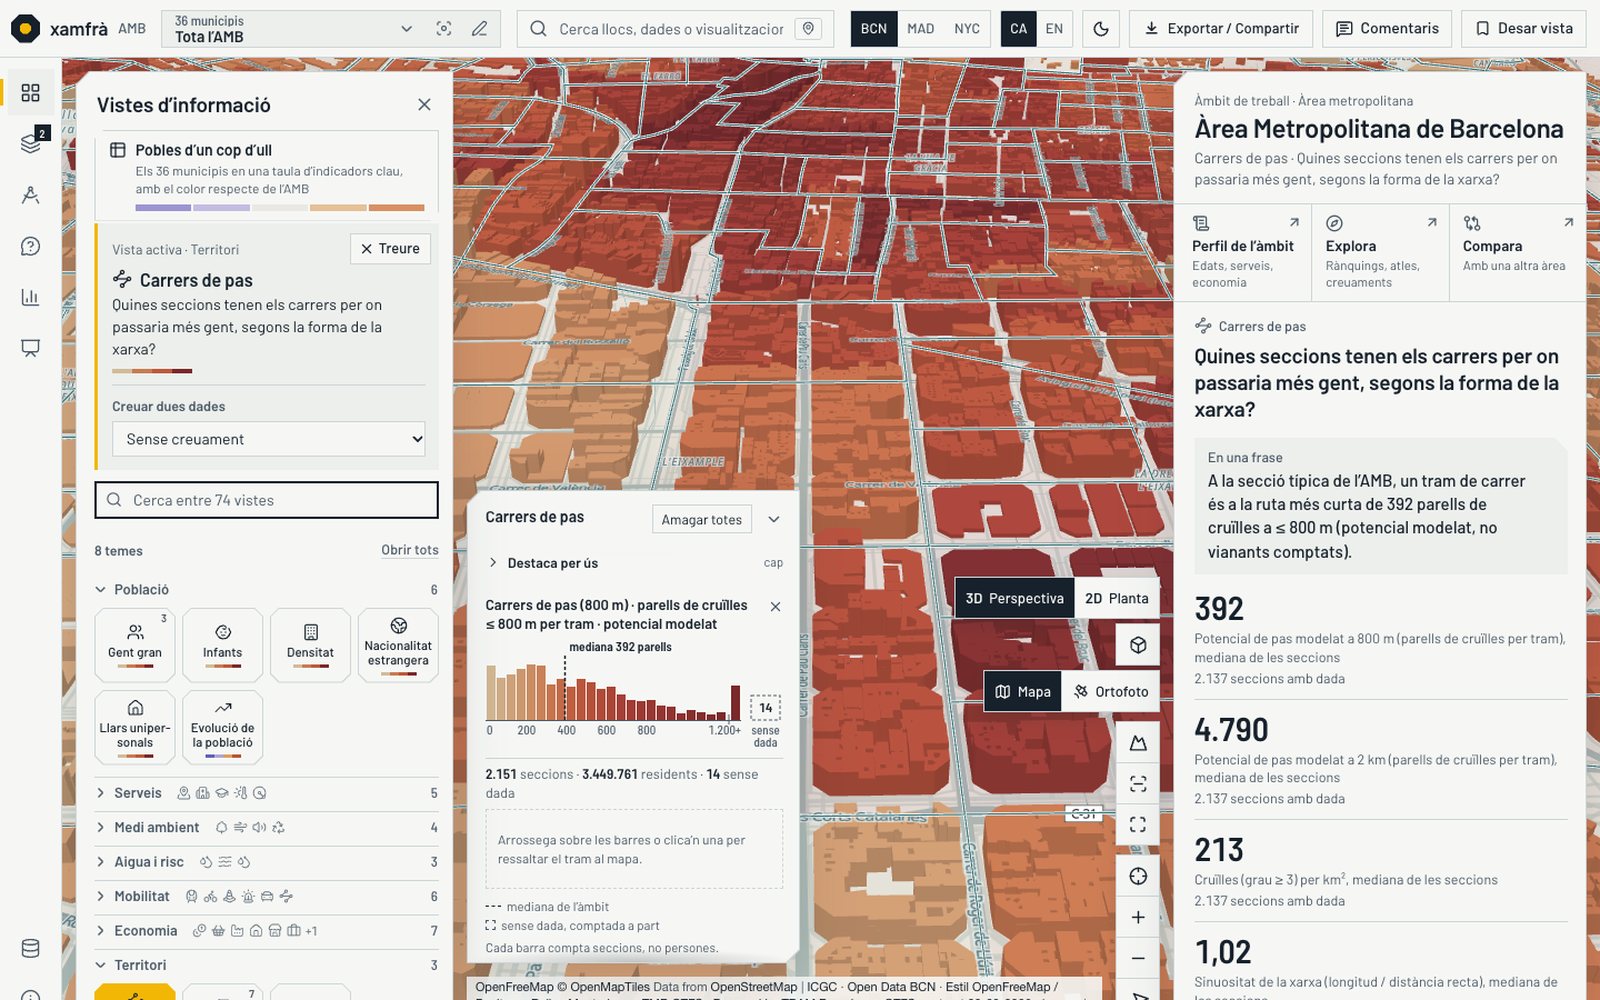
Which sections have the streets where most people would pass, given the shape of the network? The view paints each census section with the betweenness of its street segments at 800 m and 2 km, and the histogram legend lets you highlight a range on the map. It is modelled potential, not counted pedestrians.
OpenStreetMap street network (Geofabrik, 29-09-2026; ODbL) and 2,151 census sections for 2025. Value of the section, not of the building. Bridges and tunnels come out high, and it has not been calibrated against counts.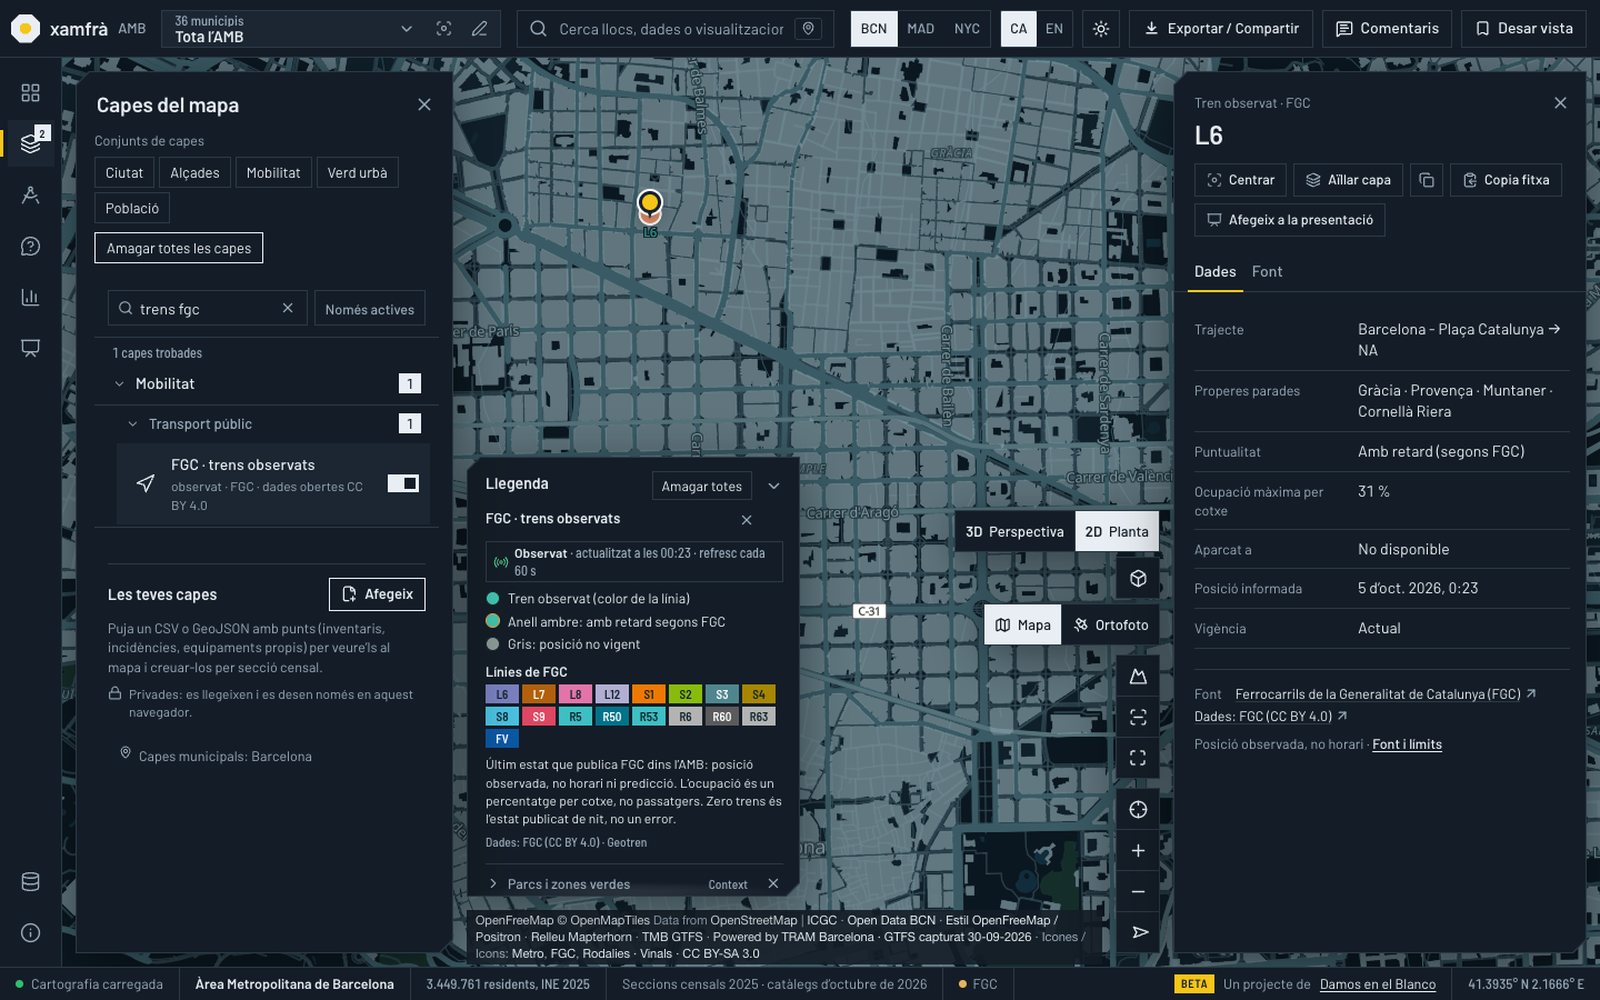
The card of a TMB metro station or bus stop shows the next trains or buses, with minutes, destination and the time of the data; it refreshes every 30 s while the card is open. The “FGC · observed trains” layer draws each train’s position and marks with an amber ring any train FGC reports as late.
TMB is an arrival forecast, not the scheduled timetable or an observed position; “no forecast” does not mean no service. FGC: observed position (Geotren), refreshed every 60 s, CC BY 4.0; occupancy is a percentage per car, not passengers. The screenshot shows an FGC L6 train.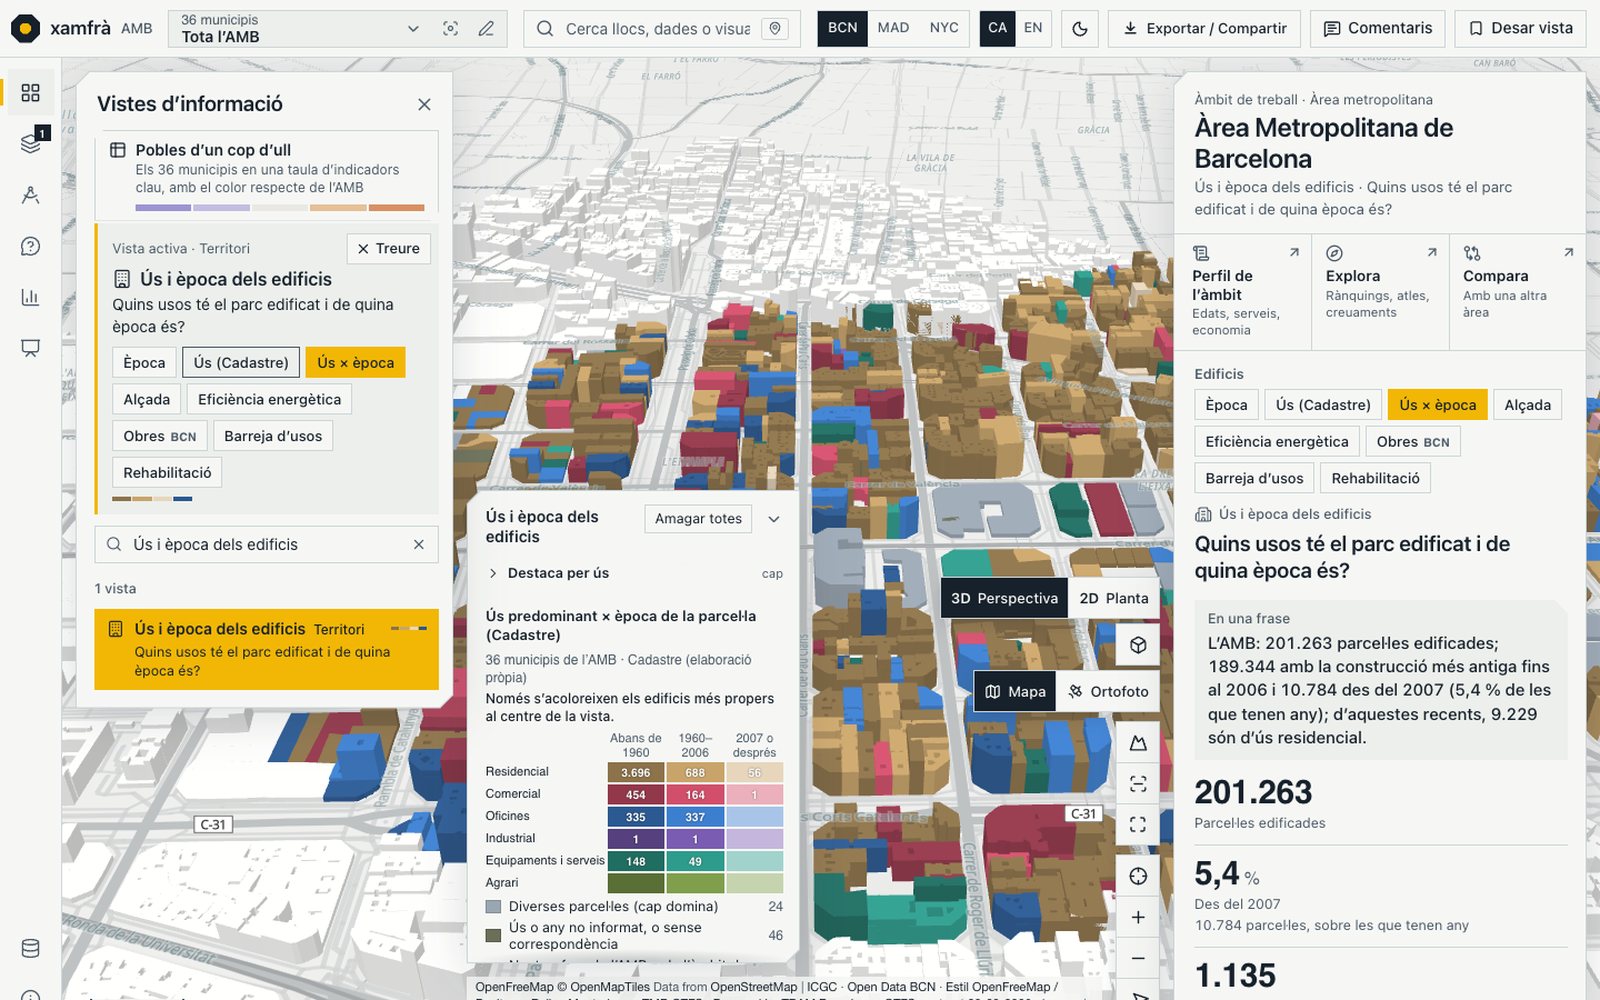
Each building takes the colour of the predominant use of its parcel, in three shades by construction period, and the panel counts parcels by use and period: 201,263 built parcels in the 36 municipalities, 10,784 of them since 2007 (5.4% of those with a year).
Cadastre, derived product: own processing of INSPIRE data from the Dirección General del Catastro. The period is that of the parcel’s oldest construction; the use is the dominant one by floor area. Not zoning and not observed use, and a parcel is not a building. 1,135 parcels have no year; on the map only the buildings nearest the centre of the view are coloured.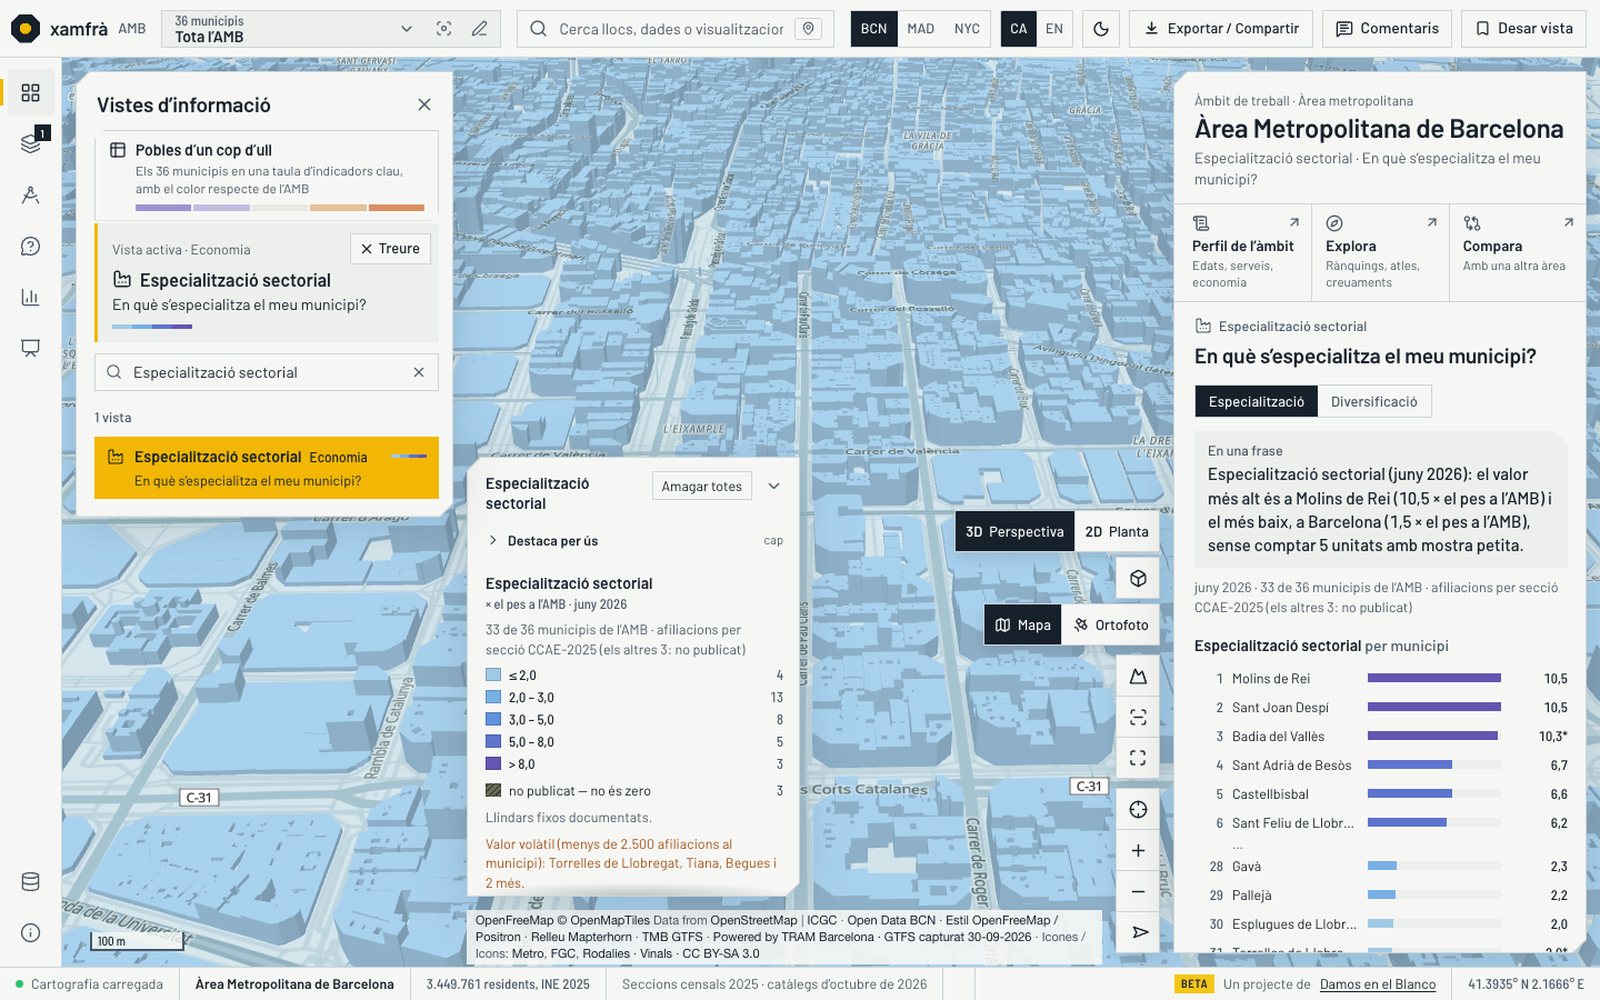
“What is my municipality specialised in?” The map paints each municipality by the sector where it weighs most against the AMB as a whole (location quotient), always with the affiliation count beside it. The municipality profile adds the diversification and the three most over-represented sections.
Social Security affiliations by contribution place (Idescat, June 2026, provisional), CCAE-2025 sections. 33 municipalities; for 3 it is not published (not zero). No quotient below 50 affiliations. Not economic complexity, clusters or innovation, and company headquarters inflate some sections.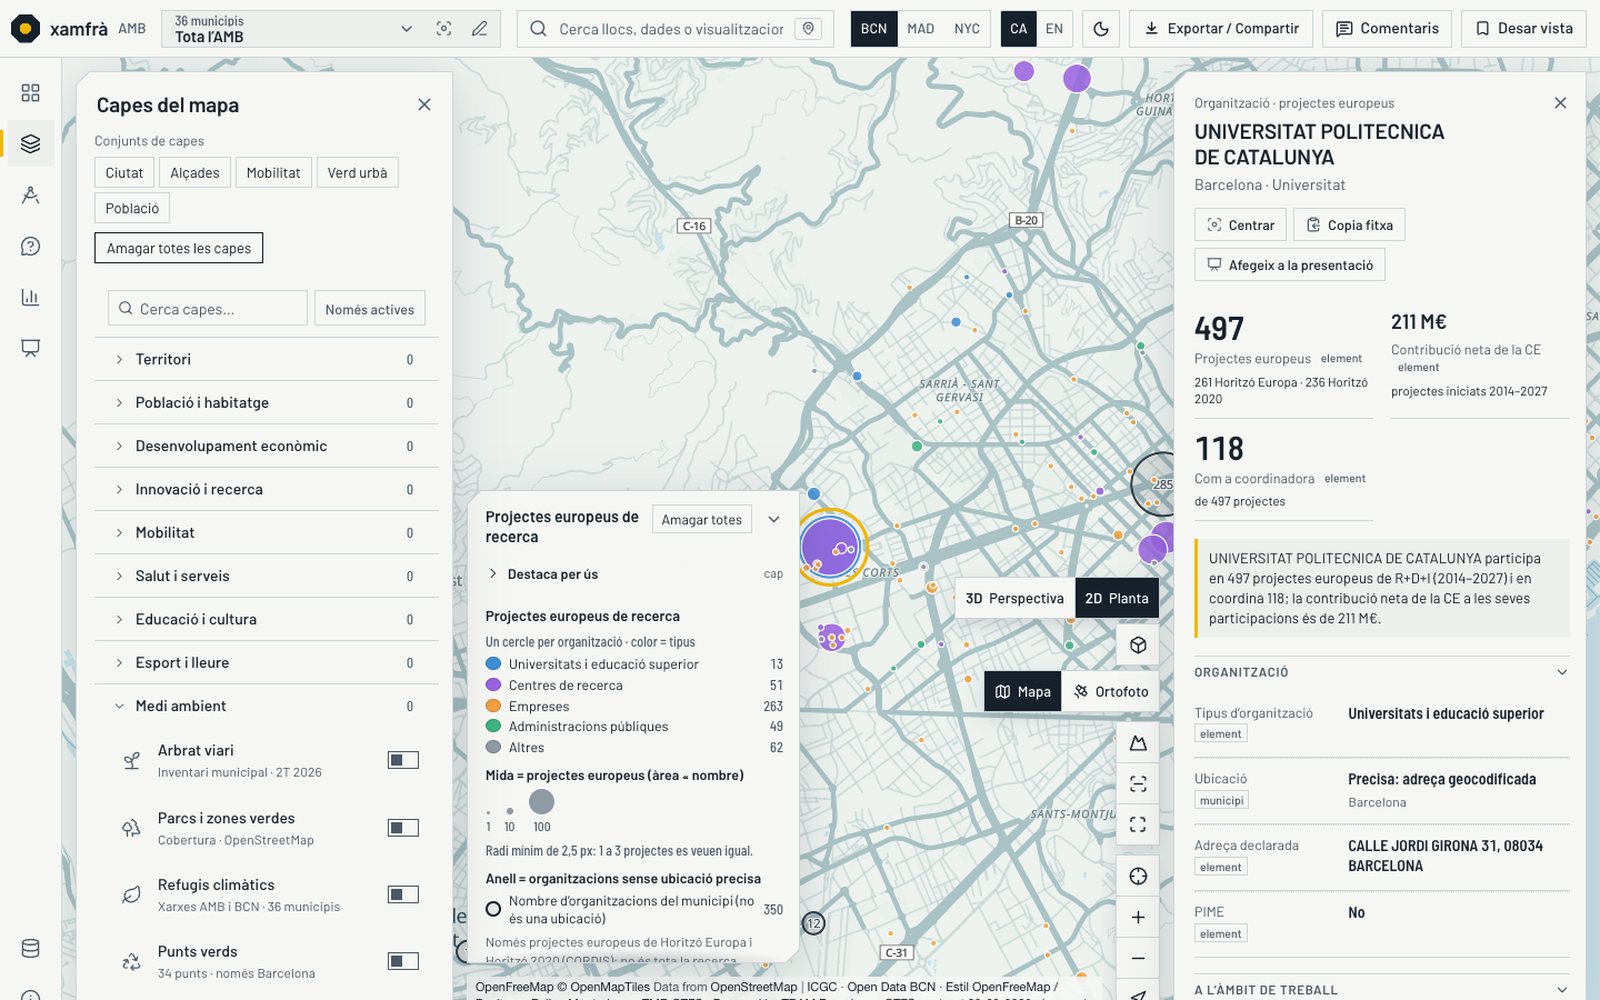
The research map grows to 300 locations from the Generalitat’s facilities catalogue (132 research and 168 teaching centres, optional). The new view adds the 788 organisations in the AMB with European R&D&I projects (4,981 projects from Horizon 2020 and Horizon Europe), and whom they coordinate and collaborate with.
CORDIS, European Commission (Commission reuse notice); aggregated by Xamfrà, not official Commission figures. The location is the organisation’s declared address, not where the research is done: 350 organisations have no precise one. Teaching centres do not measure research.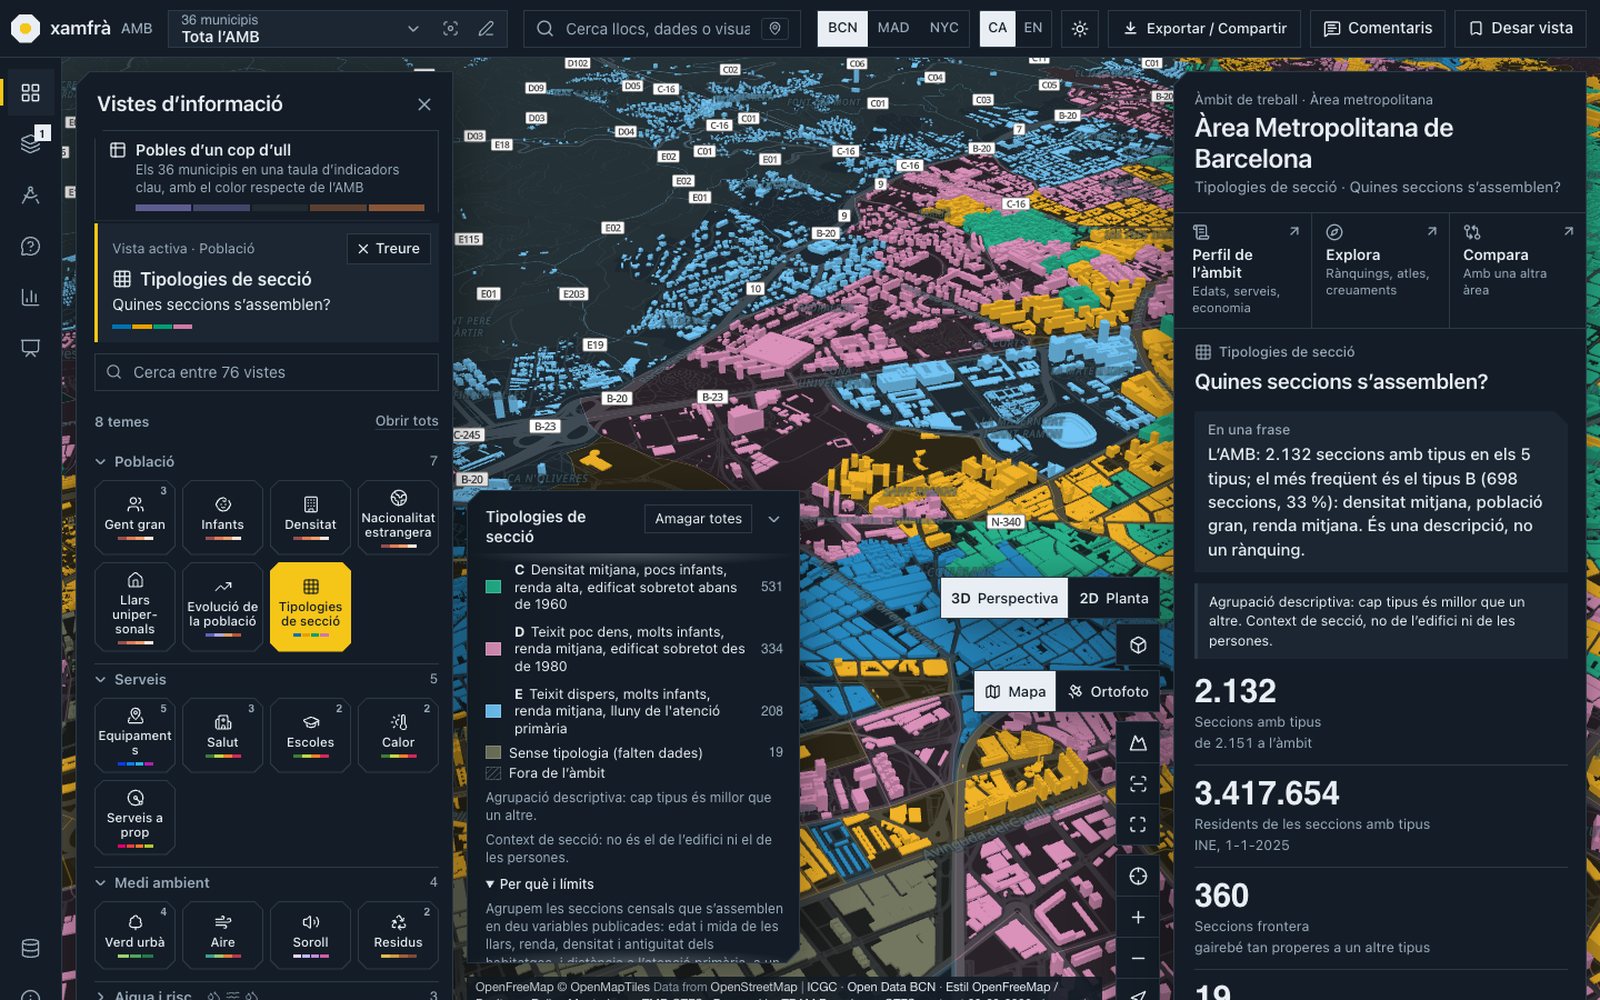
Which sections resemble each other? It groups the 2,151 census sections of 2025 into 5 types (A–E) using ten published variables and paints buildings in the colour of their type. Pick a type in the legend to highlight it and open its profile, with the medians and quartiles of each variable.
Descriptive grouping, not a ranking or a quality score: the A–E order is only median density. Value of the section, not of the building or the people; 19 sections have no type because data is missing. Sources: INE (CC BY 4.0), derived Cadastre and OpenStreetMap (ODbL).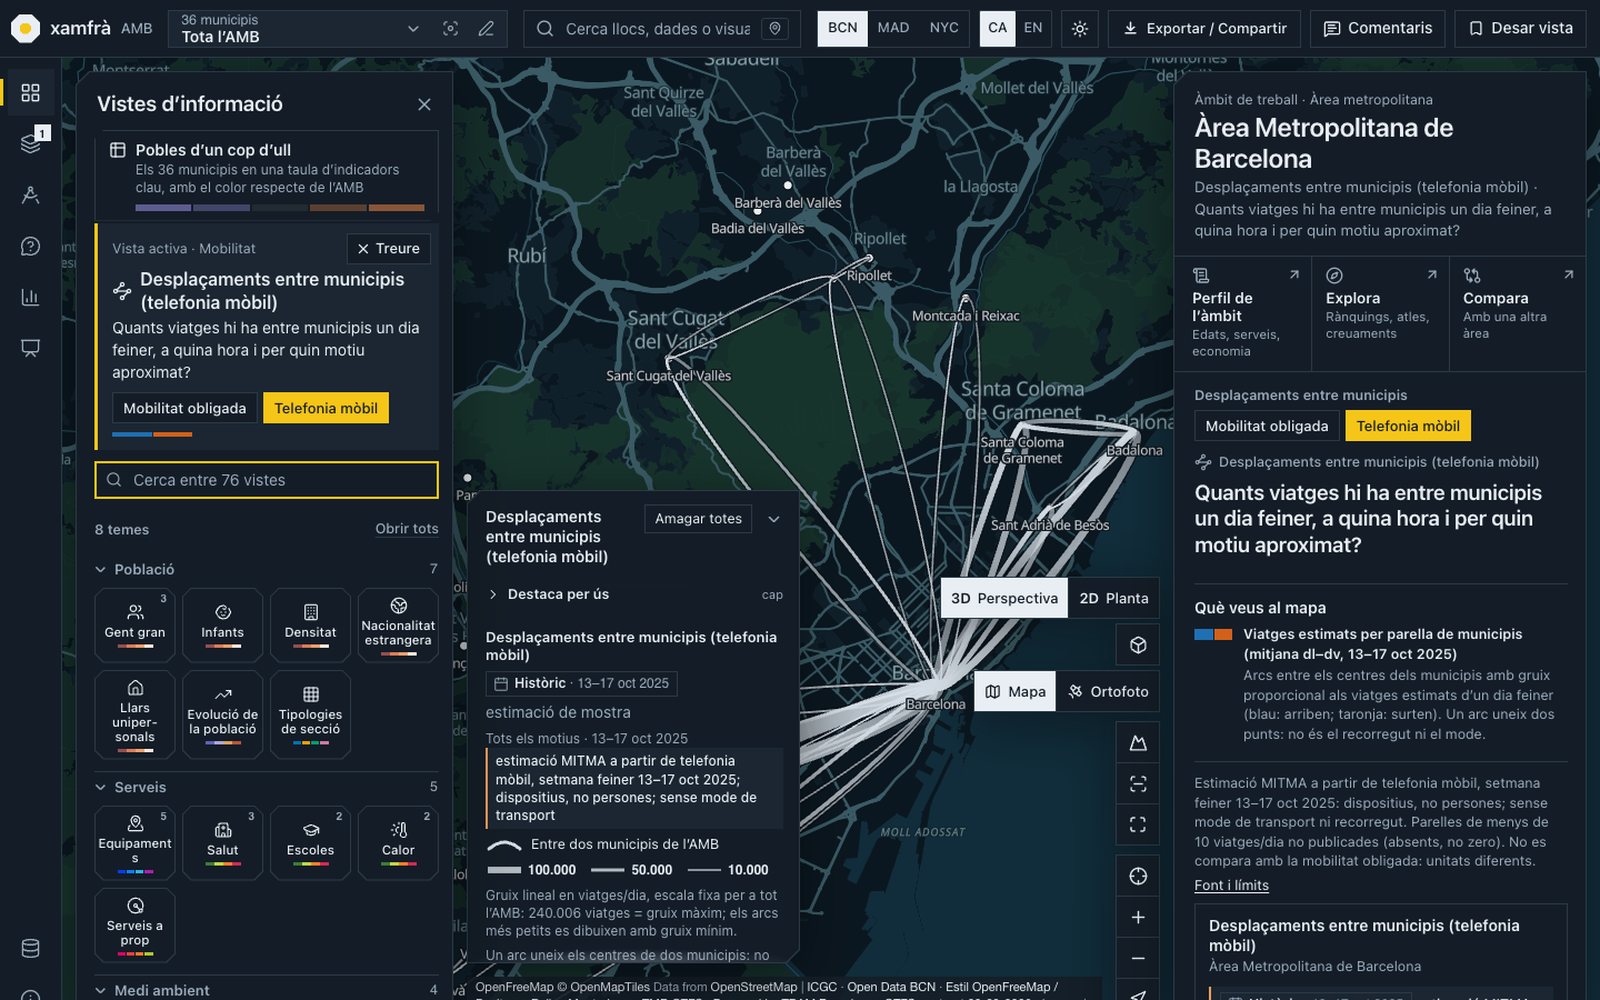
How many trips are there between two municipalities of the AMB on a weekday, at what time, and where do the people arriving in a municipality come from? Arcs join pairs of municipalities and each municipality’s card gives its origins and hourly profile. It sits beside the commuting figures from the census.
MITMA estimate from mobile phone data: Monday–Friday mean, 13–17 October 2025. Estimated trips over 500 m from devices, not people, with no mode or route. A single week, no seasonality. Based on MITMA open data.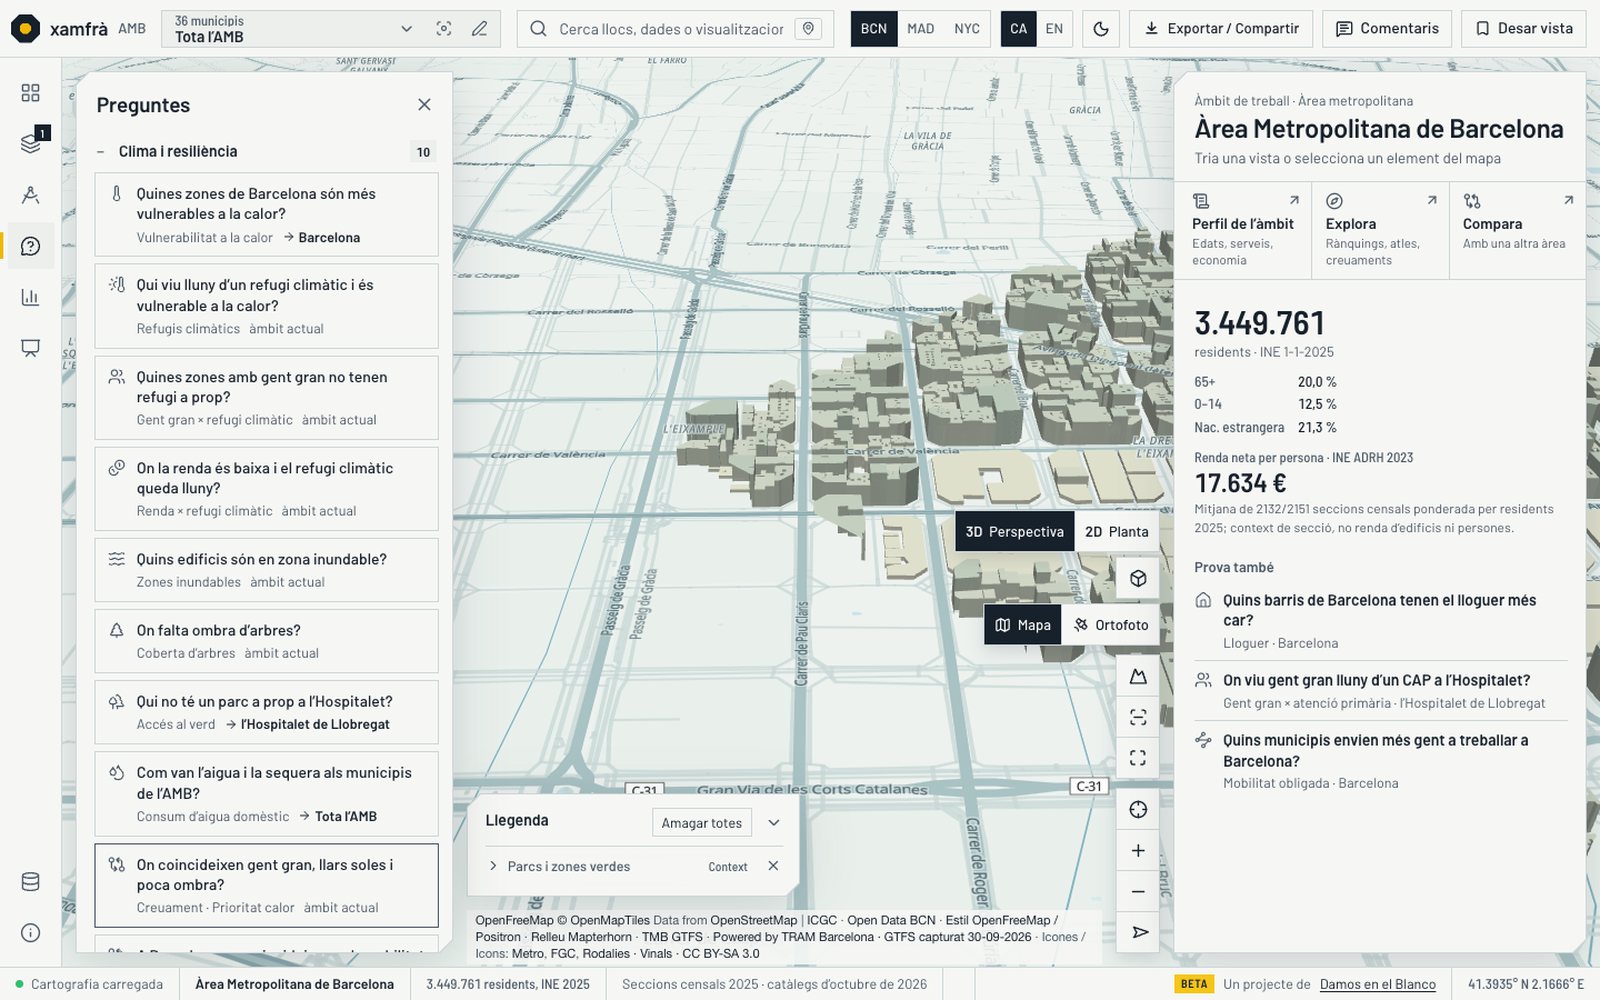
A theme that brings together heat, urban greenery, rivers and streams, flood zones and domestic water use, with 10 questions —“Which areas of Barcelona are most vulnerable to heat?”, “Where is tree shade missing?”— and a block in the area profile. It groups what was already there: there is no new index.
Heat vulnerability is the official index of Barcelona City Council and exists for Barcelona only; flood zones cover only the river stretches that have been studied (SNCZI/ACA). Each layer carries its own source and year.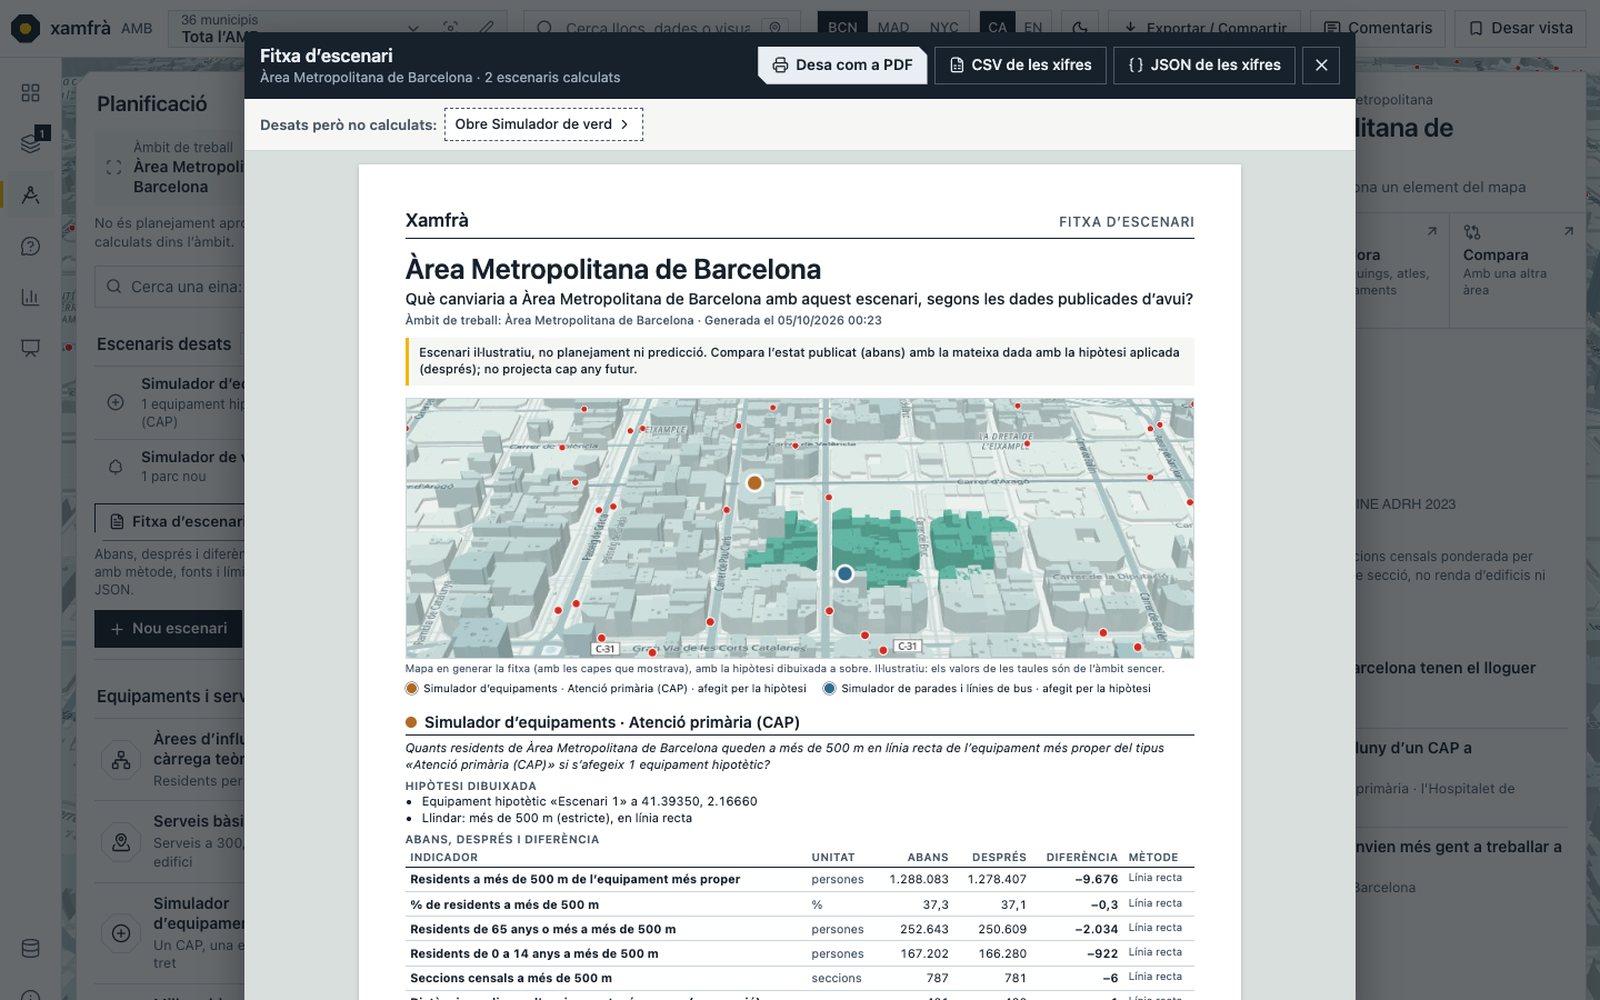
A computed scenario can be saved as a one- or two-page sheet: the question, the hypothesis, before, after and the difference, with the unit, the source and the limit of every figure. Download it as PDF, or as CSV or JSON of the figures.
Illustrative scenario, not planning: the sheet only carries figures that each simulator already computes, with no future year and no composite index. Distances are in a straight line, not walking time.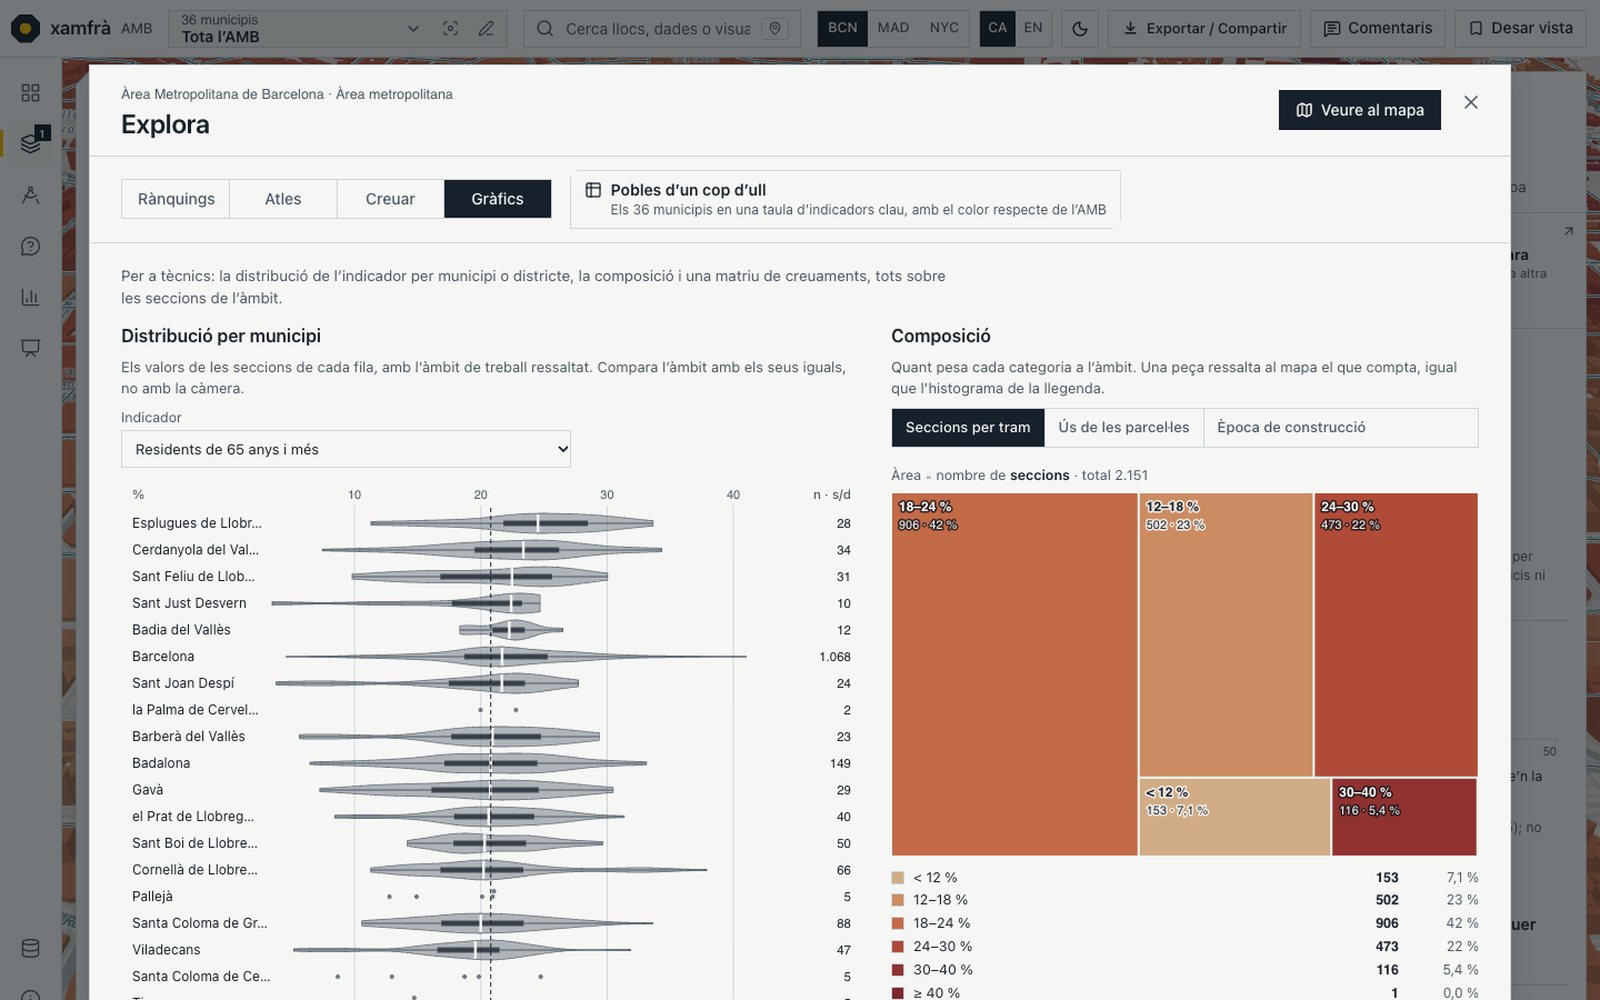
A technical tab in Explore: the distribution of an indicator by municipality or district (median and quartiles), the composition by sections in a treemap that highlights the map, and a crossing matrix with the ρ and the number of sections in each cell.
Sections are counted, not people. Groups of fewer than 10 sections appear as dots, and each row says how many sections have no data. Association between sections, not cause. The screenshot shows residents aged 65 and over, by municipality.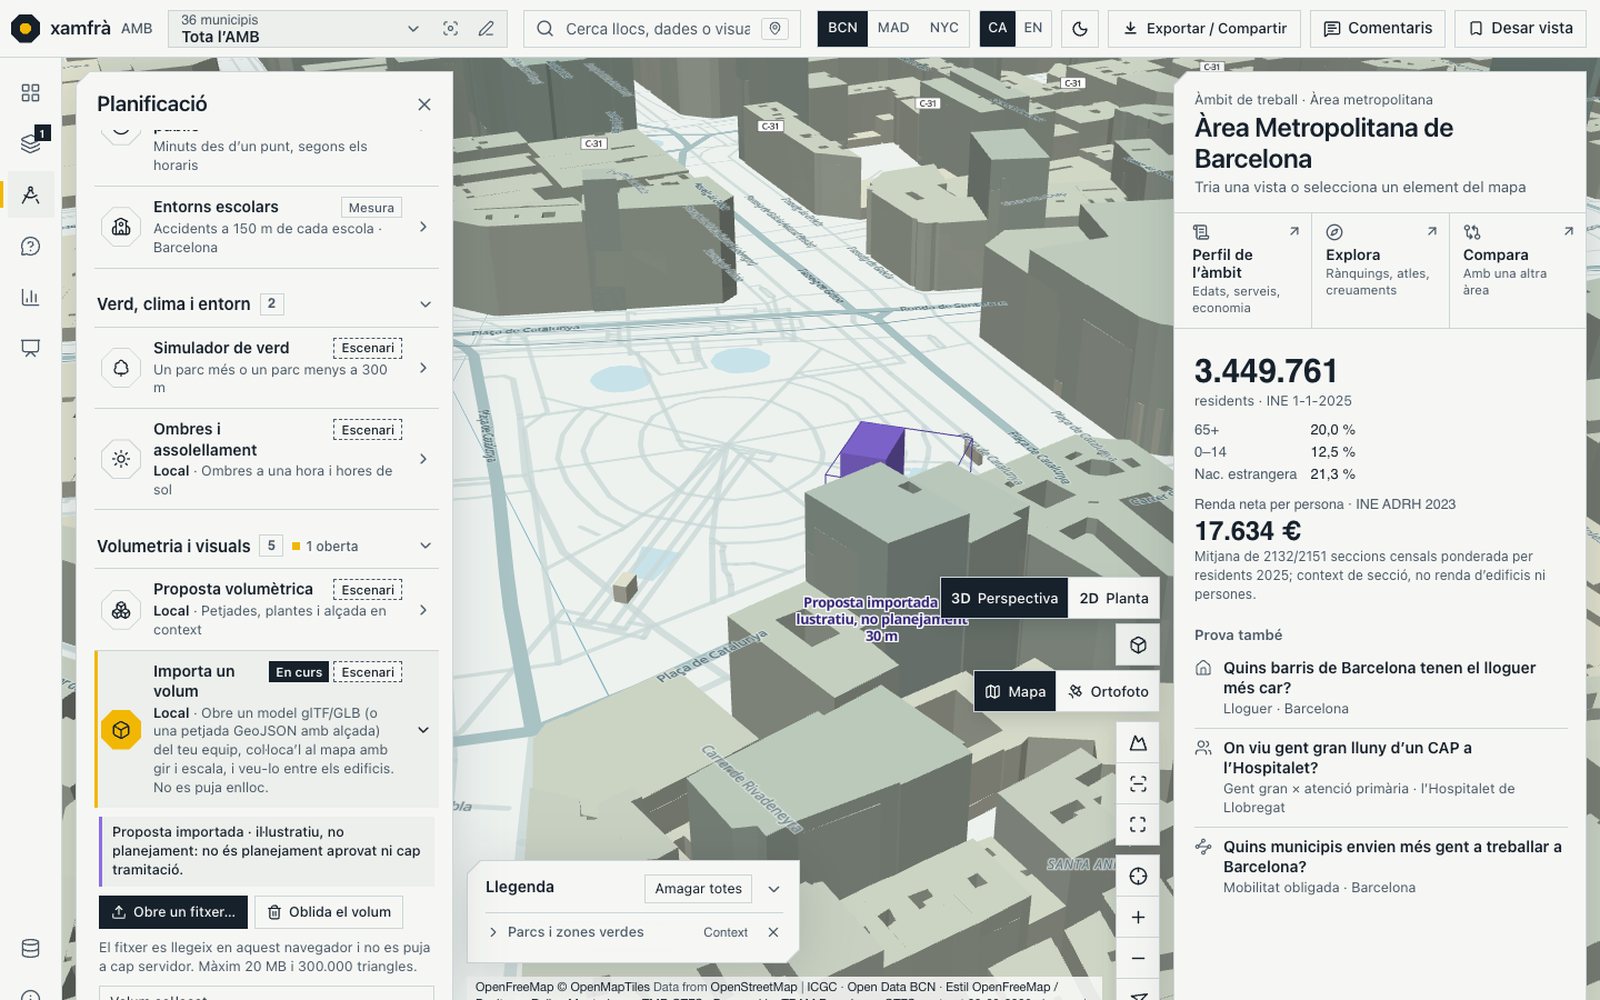
Open a glTF or GLB file (or a GeoJSON with footprint and height) and place it on the real city with one click, with rotation, units, scale and height above ground, in 2D and 3D. The file is read in the browser and is never uploaded to a server.
Imported proposal, illustrative, not planning. Up to 20 MB and 300,000 triangles; base colour only, with no textures or cast shadows. The height is the file’s own: it is not checked against the Cadastre or the regulations.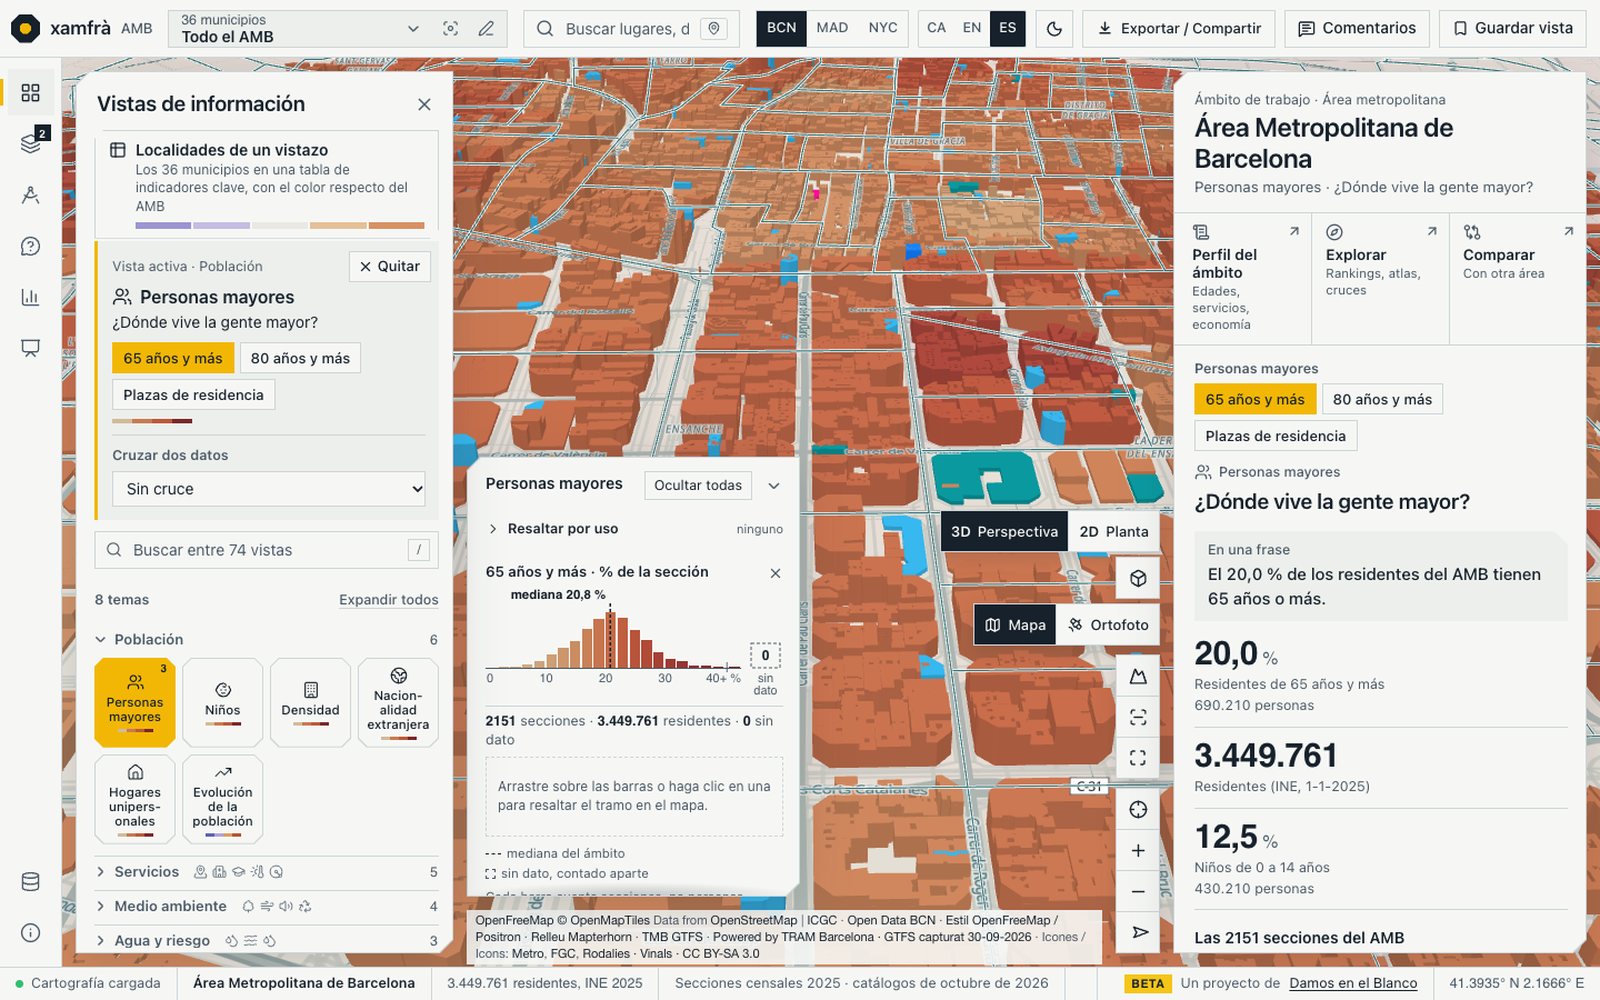
Menus, views, questions, legends and cards can now be read in Spanish, alongside Catalan and English, for the AMB as well as Madrid and New York. Switch with the language selector in the top bar.
Only the interface text changes, not the data. The official names of sources are kept, and where a text has no Spanish translation yet, it is shown in English.Earlier updates
Since 3 October 2026 the viewer searches, compares and presents without leaving the map, and groups the simulators by theme. Five short demonstrations, recorded in the test viewer on 4 October 2026 and without sound, and the rest of the changes, each with its source and its limits.
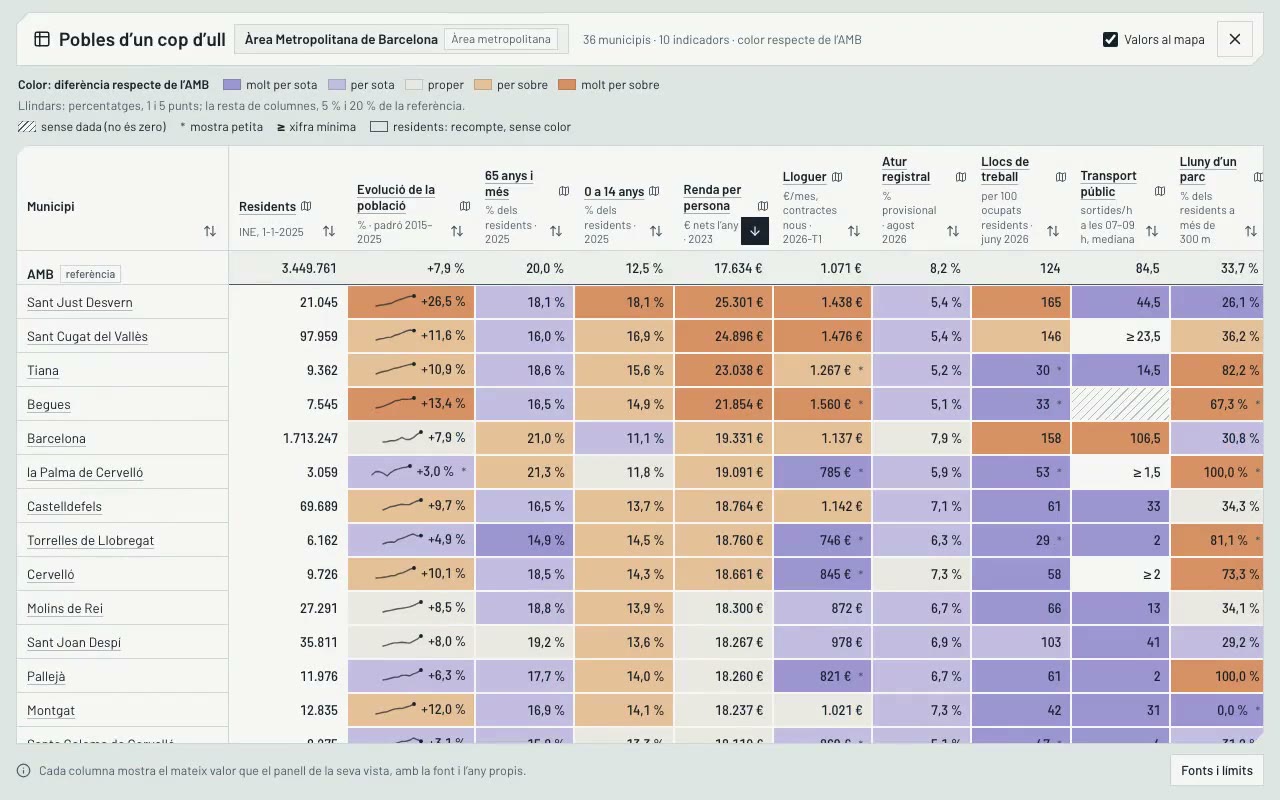
The 36 municipalities in a table of ten indicators, with each cell coloured by its difference from the AMB. A click on a header arrow sorts the column, the map icon opens the corresponding view and “Values on the map” writes the figure on each municipality. Where there is no data, the cell is hatched, not zero.
In the video, net income per person: INE, Household Income Distribution Atlas 2023, sections weighted by 2025 residents.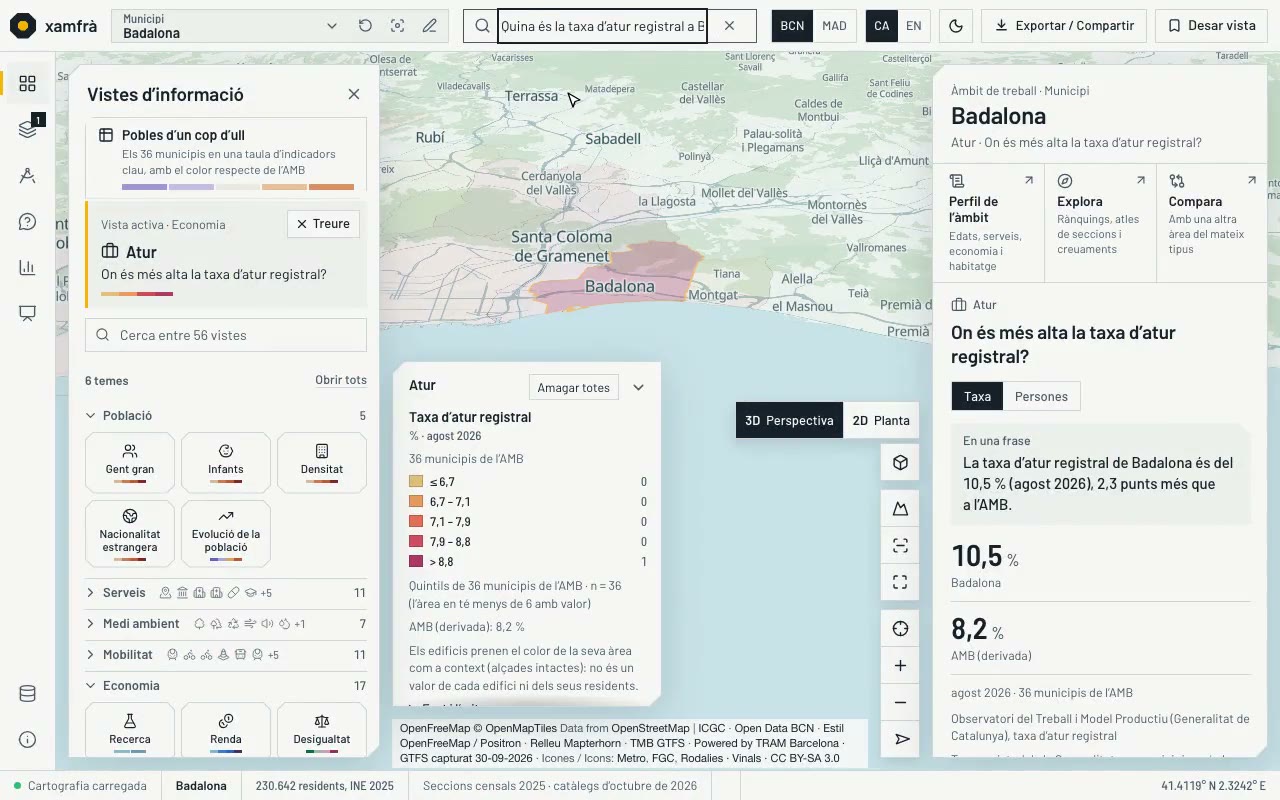
Areas, views, questions, places, tools and data sources in a single box. “atur Badalona” suggests the question; a click sets Badalona as the work area, opens the Unemployment view and answers in one sentence, with the AMB reference.
Registered unemployment rate for August 2026, provisional: Observatori del Treball i Model Productiu, Generalitat de Catalunya. The search calculates nothing: it opens what the viewer already knows how to answer.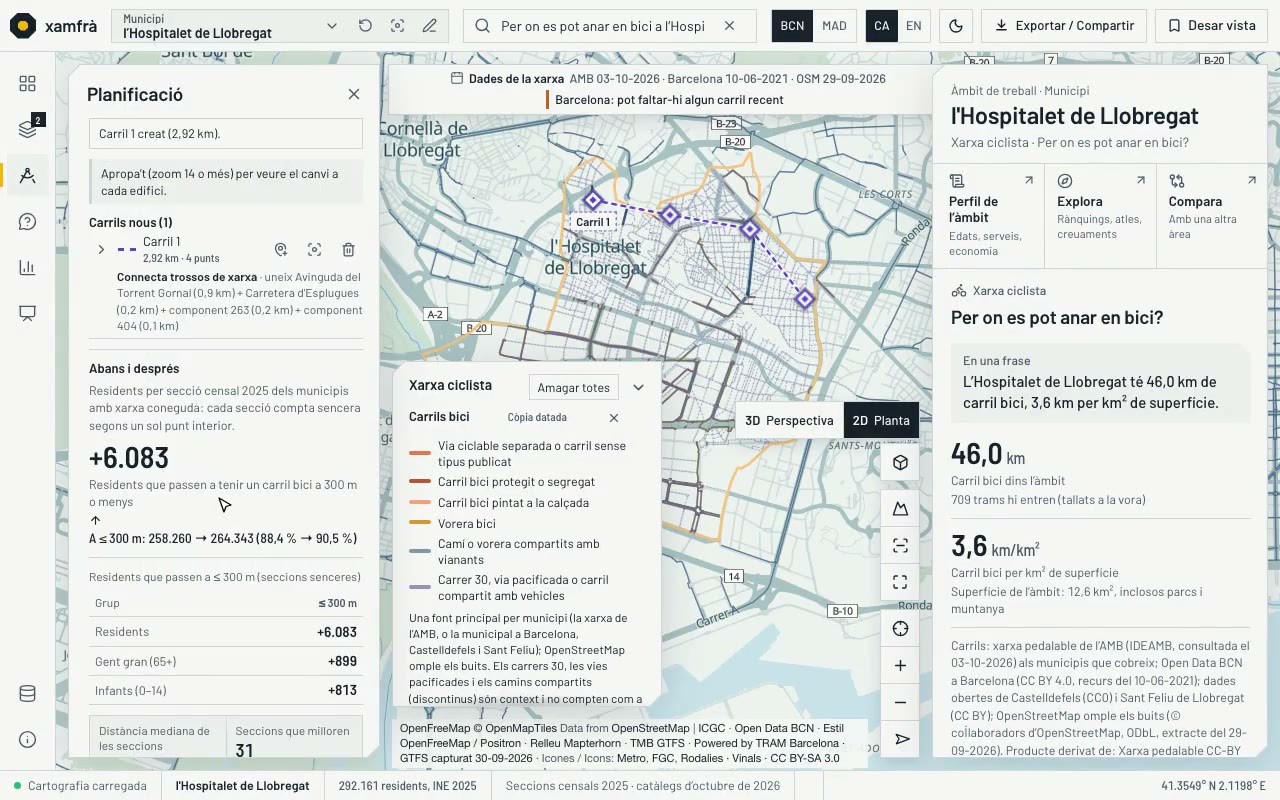
The AMB cycling network in a single layer, by type. Then the Planning simulator draws a new lane in l’Hospitalet de Llobregat and counts how many residents would have a bike lane within 300 m or less. It is a scenario: it does not change the official data.
Rideable network of the AMB (IDEAMB, CC BY 4.0) in 33 municipalities; Open Data BCN, Castelldefels and Sant Feliu de Llobregat; OpenStreetMap to fill gaps. File under ODbL. Network known in 33 of the 36 municipalities: in Sant Adrià de Besòs, Santa Coloma de Gramenet and Torrelles de Llobregat it is unknown, not zero.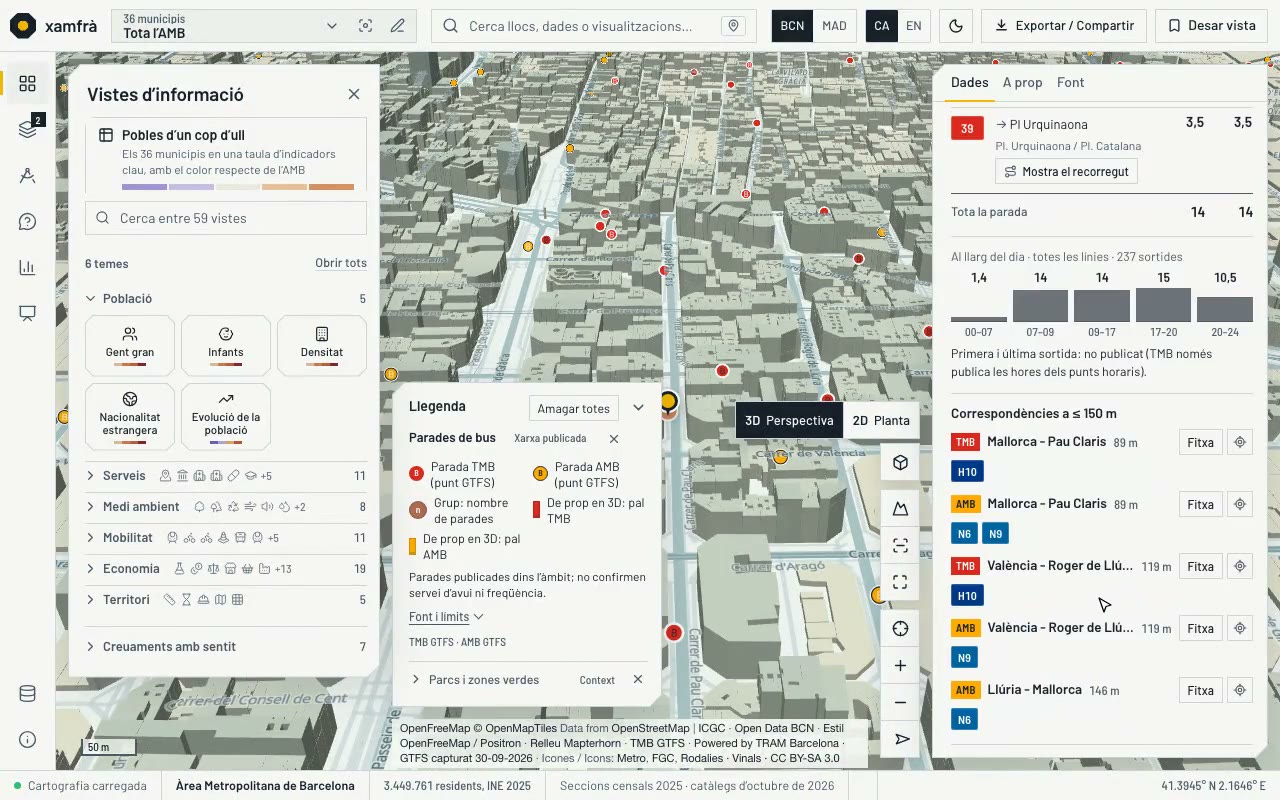
A click on a building shows the nearby stops and stations; a click on a stop opens its card: the lines that stop there and their destination, departures per hour from 7 to 9 and from 9 to 17, the day profile, connections within 150 m and, where the operator publishes it, the first and last departure.
Scheduled timetable from the operators’ GTFS for a weekday (Tuesday 6 October 2026), not live service. TMB bus and metro have no first and last departure, and part of the TMB bus times are interpolated.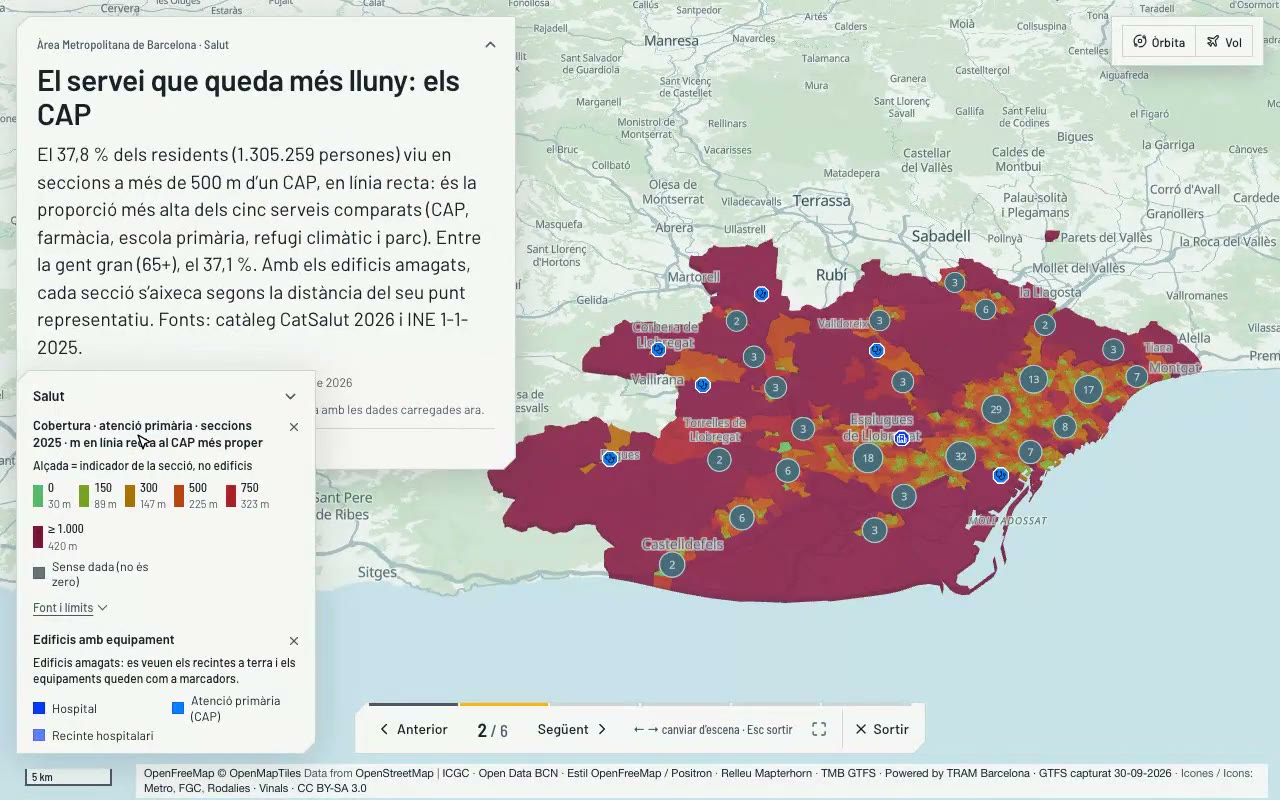
For the AMB, any municipality or a district or neighbourhood of Barcelona, the Presentation drawer generates a narrative of up to six scenes —who lives there, service gap, public transport, economy, environment and a close-up— and presents it full screen.
Fixed templates, no language model: each scene carries the panel’s figure, with the period and the source, and a scene with no data for the area is omitted, not shown as zero. Not yet in the Madrid region.Questions about your municipality
The Questions drawer offers, under “About…”, up to 16 questions for the chosen area: the AMB, a municipality or a district or neighbourhood of Barcelona. Only those with data for that area appear.
Extended comparison
The Compare tab puts two areas side by side in six blocks, from public transport to road safety and commuting. A row only appears if both have the figure from the same source. Try a sample.
Planning by theme
The Planning drawer groups 17 tools into five themes: facilities, housing and density, mobility, green and climate, and massing and visuals. Each tool says whether it is a measure or a scenario, and scenarios can be saved.
School surroundings
Collisions handled by the Guàrdia Urbana in 2025 within 150 m or less of each school in Barcelona: 159 of the 754 schools with data have at least one with deaths or serious injuries. This is concentration, not risk; outside Barcelona, unknown.
Service level per building
Scheduled departures per hour within reach of each building: bus within 300 m and train, metro or tram within 500 m, in a straight line. The residents of each section are distributed among its residential buildings: it is an estimate, and the viewer marks it with ≈.
Guided tour
The first visit opens a seven-step walkthrough: the work area, the views, the legend, a building, the panel, Planning and how to ask, present and export. It can be reopened from “The project”.
Accessibility
On 3 October we audited the viewer against standard EN 301 549 (WCAG 2.1 AA): there is one blocker, nine serious issues and fourteen minor ones, and it is not yet fully conformant. You can now select on the map without a mouse (Enter at the centre of the map or the “Select at centre” button), draw an area with the keyboard, leave planning modes with Escape and zoom with two fingers outside the map on mobiles (not tested on real devices). The remaining fixes are in progress.
Madrid, second region
The Community of Madrid is now in testing: 179 municipalities, 4,518 census sections and 17 views, with the search and “Municipalities at a glance”. There are still fewer sources than for the AMB. Cities.