xamfrà a project by Damos en el Blanco CAENES Enter the viewer Request access

New in the viewer · 10 October 2026

The same city, in new 3D.

The viewer now draws the metropolitan area with Mapbox GL JS: façades, landmarks and trees in 3D, daytime or dusk light depending on the theme, and every building painted with the answer to the question you ask. The data, the sources and the limits don’t change; how they look does.
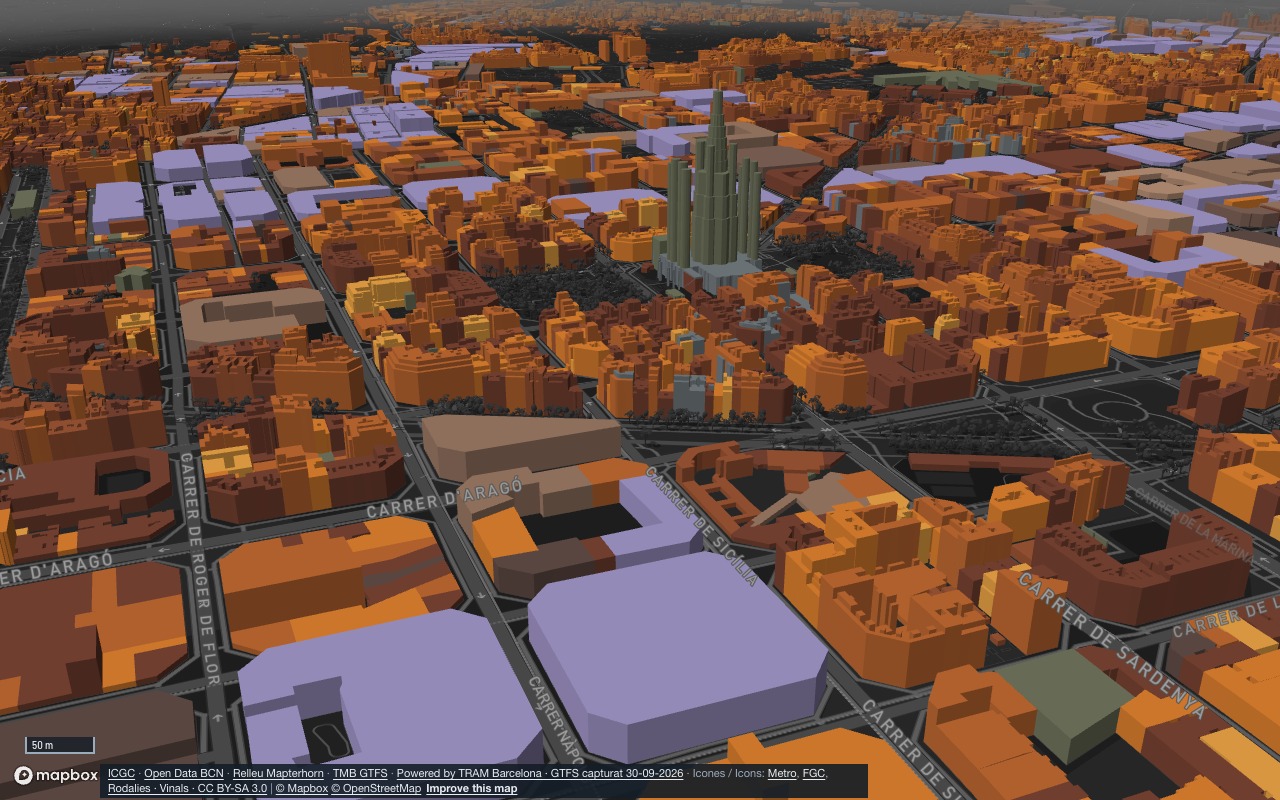
Dusk camera flight from Barcelona’s port to the Sagrada Família, with buildings painted by construction period
ObservedBarcelona at dusk, from the port to the Sagrada Família: each building takes the construction period of its parcel in the Cadastre. Recorded in the viewer, unretouched.
Request access See the difference Viewer captures from 11 October 2026, with the map attribution as it appears on screen.

By day and at dusk

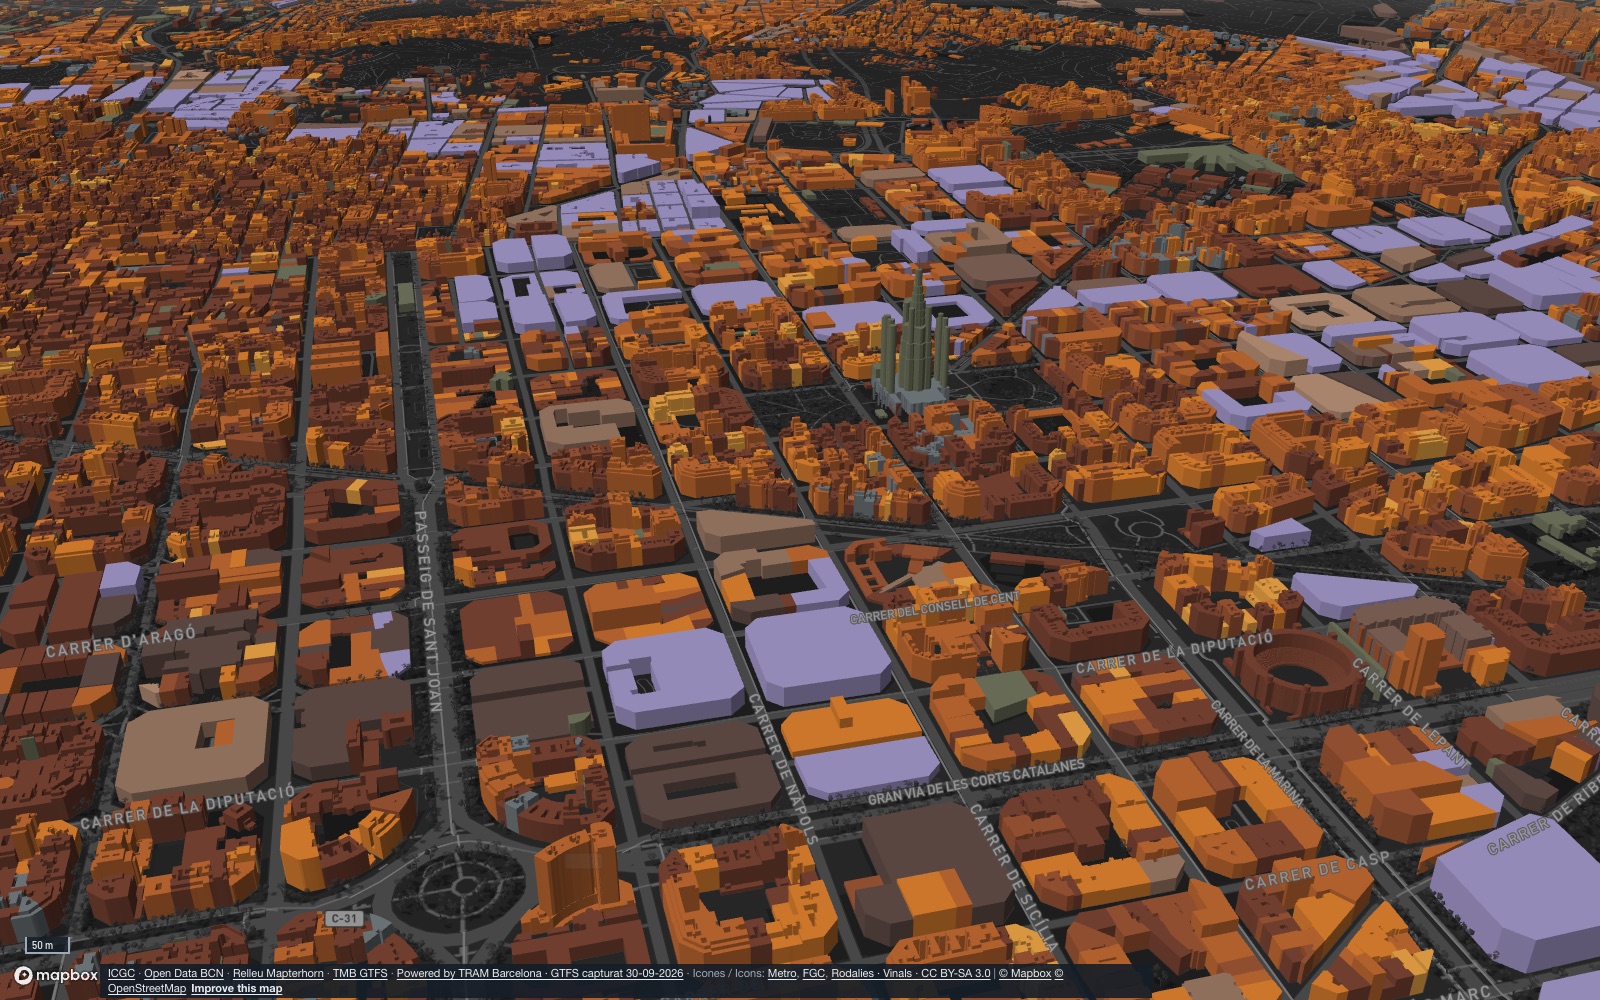
The same camera over the Eixample and the Sagrada Família. In the light theme, with no view open, the map is the city by day, with landmarks, façades and trees. In the dark theme with a view open, the city turns monochrome and the buildings light up in the colour of the data. Drag the control to compare them.
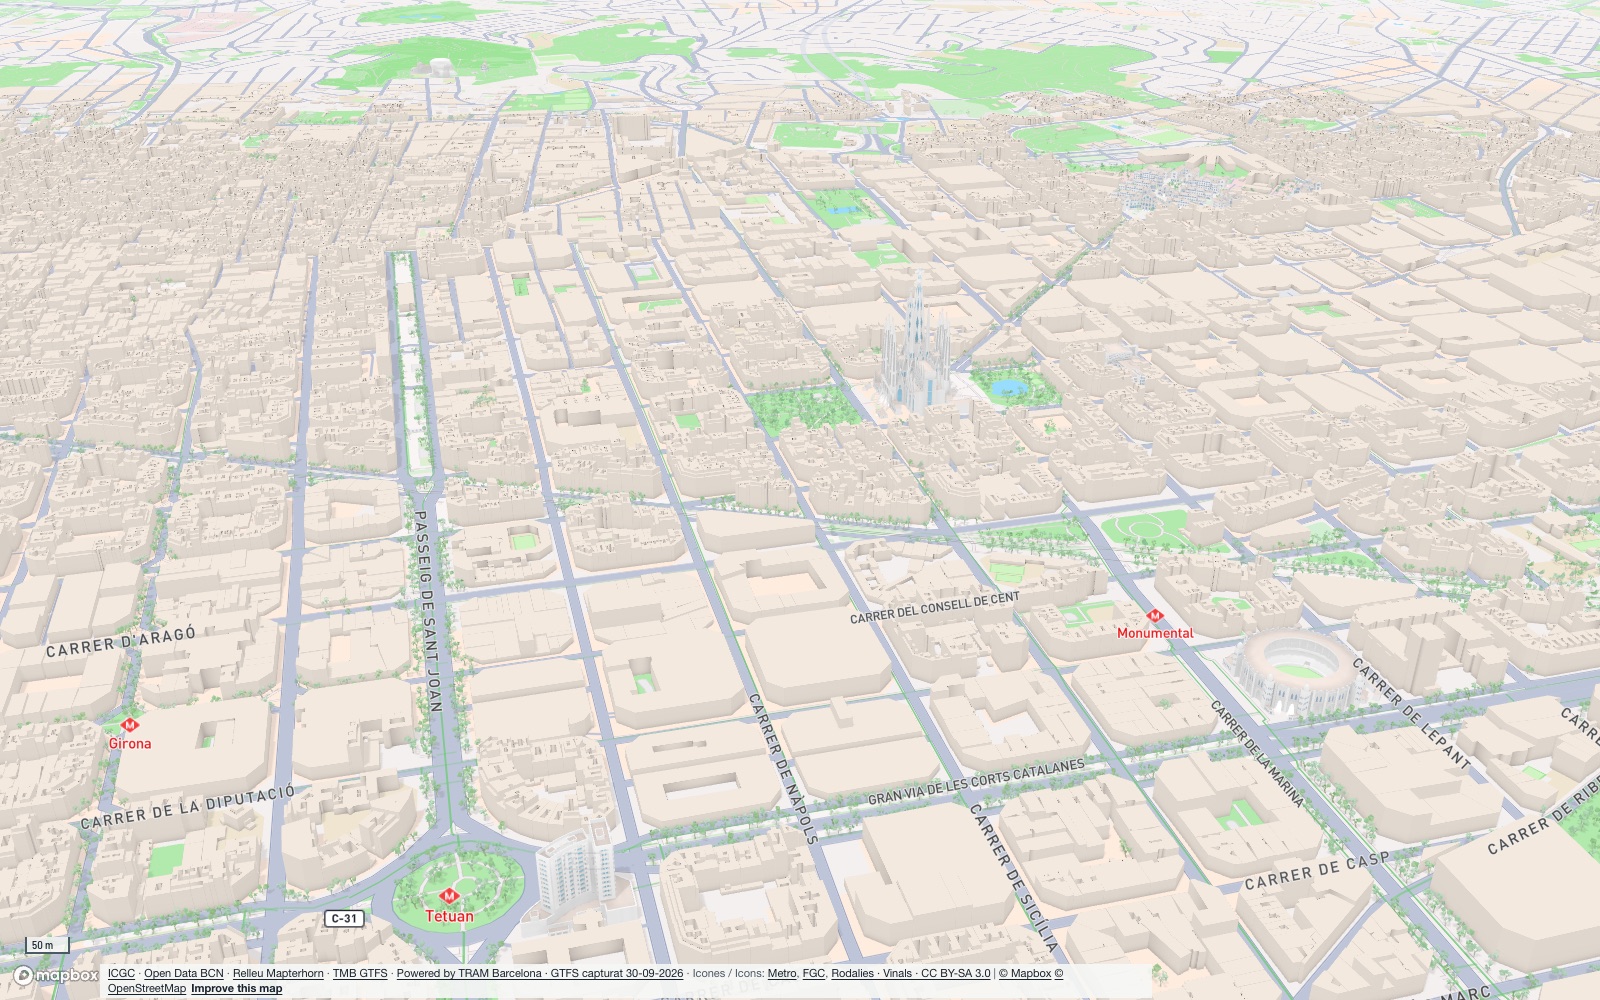
The Eixample and the Sagrada Família by day, with façades, trees and the landmark in 3D
Light theme, no view: the city by day.
The same view at dusk, with buildings painted by construction period
Dark theme, Building period view: dusk with data.

3D landmarks are hidden when a view paints the buildings: that way the colour is always the data, never the texture of the model.

Context without a view

Landmarks, façades and trees

With no question open, the map helps you get your bearings: the Sagrada Família or the Torre Glòries are recognisable at a glance, the trees of streets and parks are there, and the relief of Montjuïc and Collserola reads without a legend.

  • Trees: those of our LiDAR inventory in the greenery view; elsewhere on the map, the engine’s own.
  • Buildings: the engine’s volumes, painted with our data building by building.
  • Light: follows the theme. Light is day; dark is dusk, with Xamfrà’s graphite colours.
InterfaceFrom the Sagrada Família to Torre Glòries, by day and with no view open.

Every question paints the city

The viewer’s 192 views use the same engine. Here are nine of the newest, in recognisable places. Each caption says what is observed, what is area context and what is our own calculation.
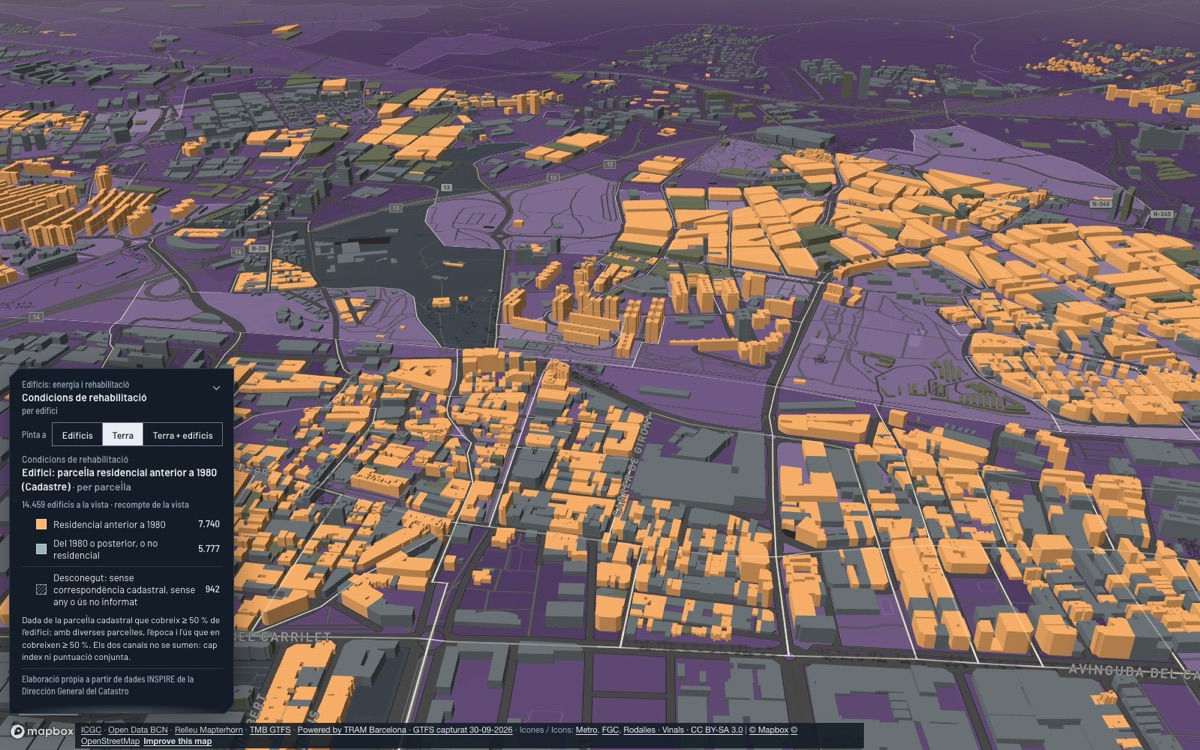
L’Hospitalet at dusk with residential buildings from before 1980 in orange
Rehabilitation conditions · L’HospitaletObservedResidential buildings from before 1980 according to the Cadastre, in orange; on the ground, the energy-poverty criteria of each section.
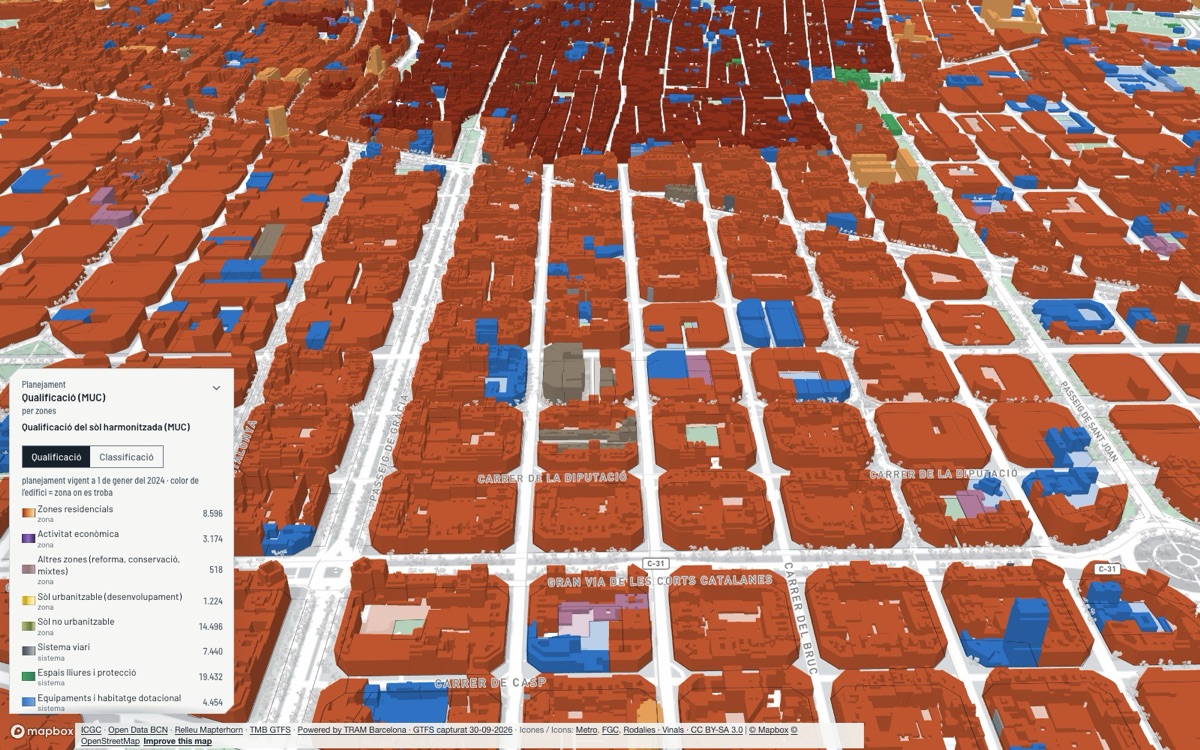
The Eixample with each building painted by its urban zoning
Urban zoning · EixampleOfficialEach building takes the zone or system of the AMB’s harmonised planning where it stands.
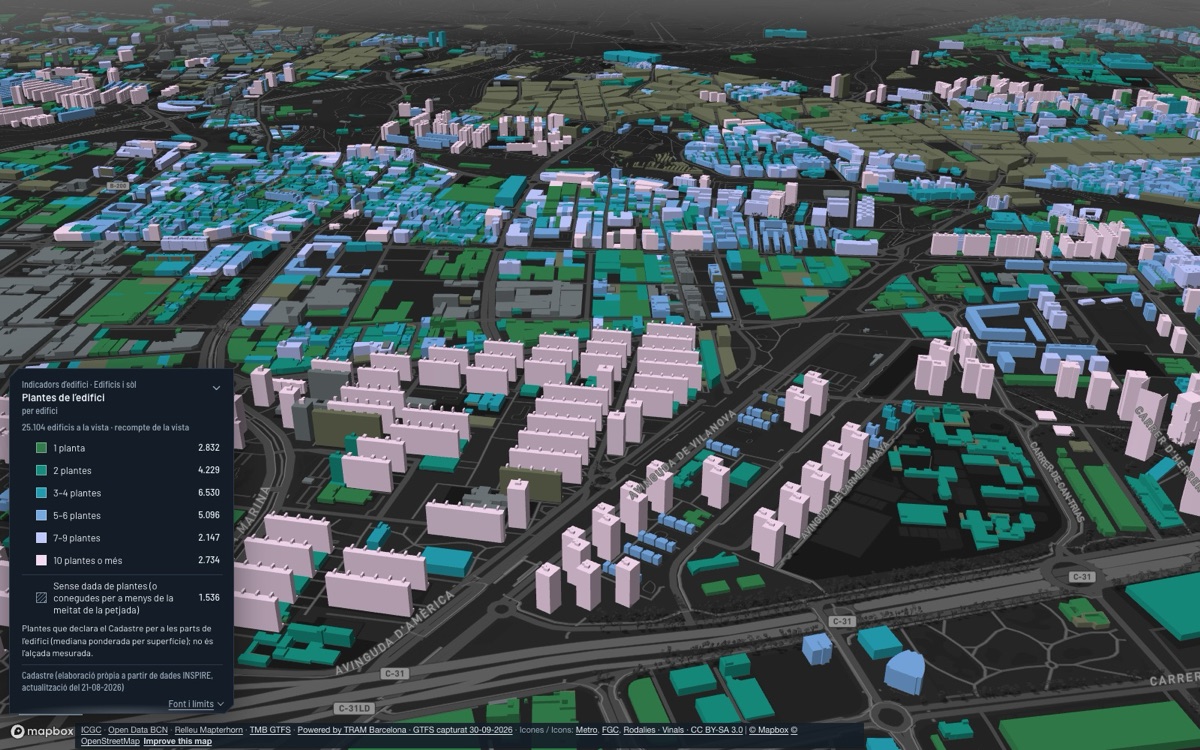
Bellvitge at dusk with buildings painted by number of floors
Building floors · BellvitgeObservedHow many floors each building has according to the Cadastre: Bellvitge’s blocks of ten floors or more, in pink.
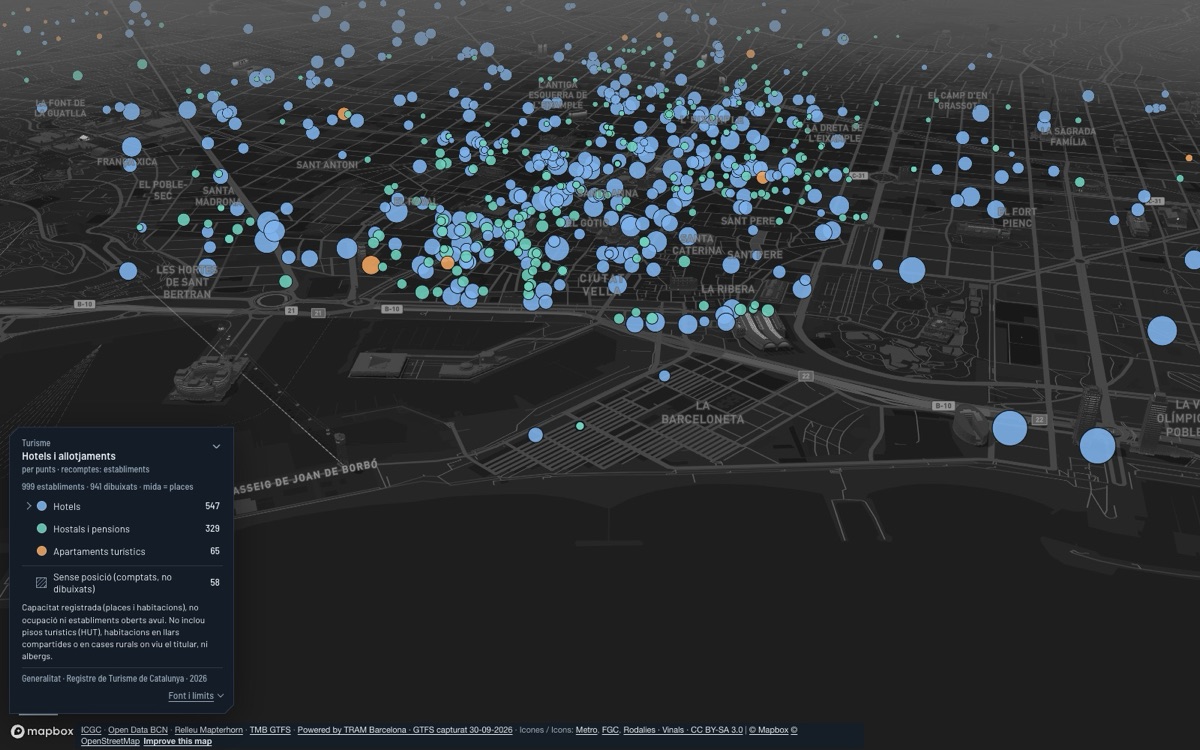
Port Vell and Barceloneta at dusk with hotels and accommodation marked
Hotels and accommodation · Port VellObservedWhere the hotels and tourist accommodation are, in what category and with how many places.
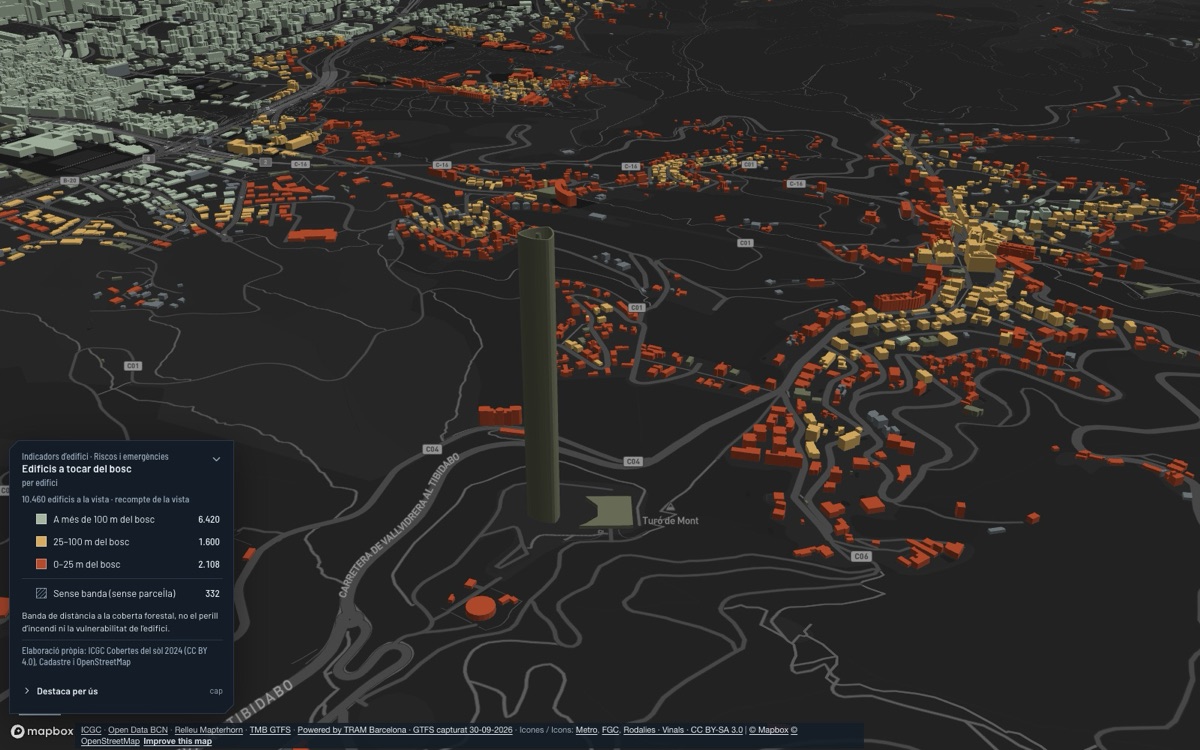
Vallvidrera and the Collserola Tower at dusk with buildings near the forest in orange and red
Buildings next to the forest · VallvidreraOwn methodBuildings less than 100 metres from Collserola’s forest vegetation, where wildfire prevention starts.
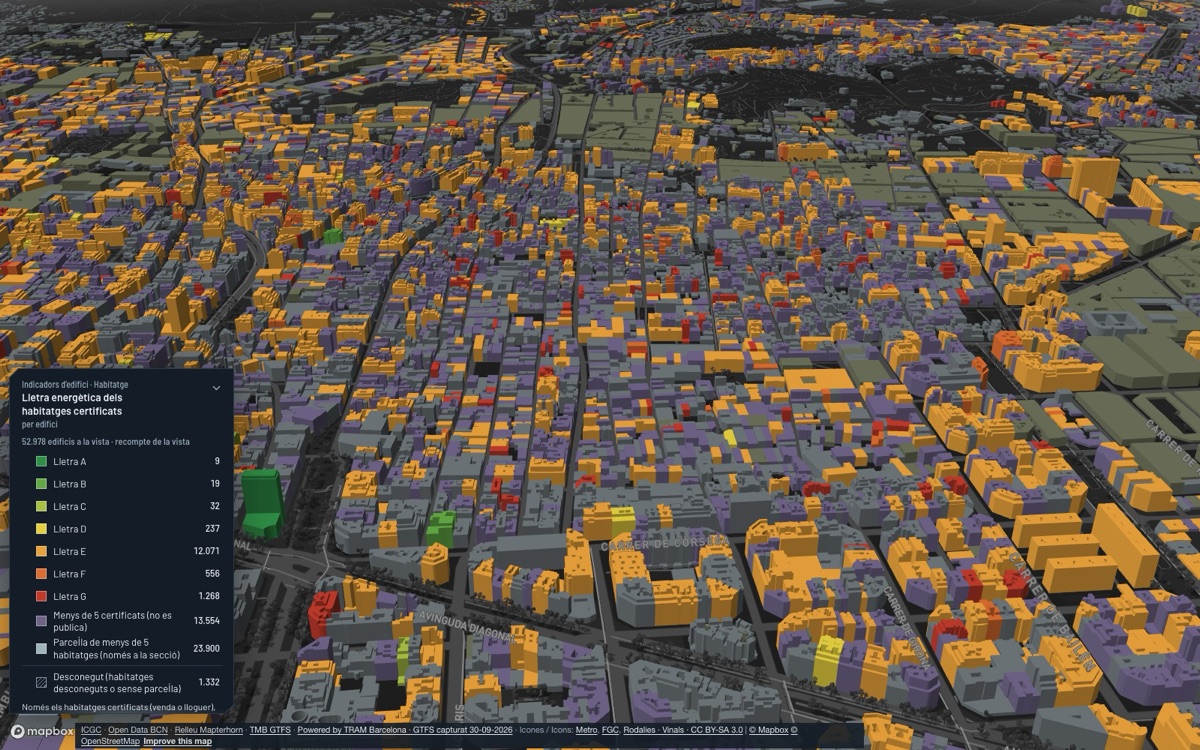
Gràcia and the Eixample at dusk with buildings painted by the energy rating of their certificates
Energy rating · GràciaOfficialThe consumption rating that dominates the energy certificates of each parcel; with fewer than five, it is not published.
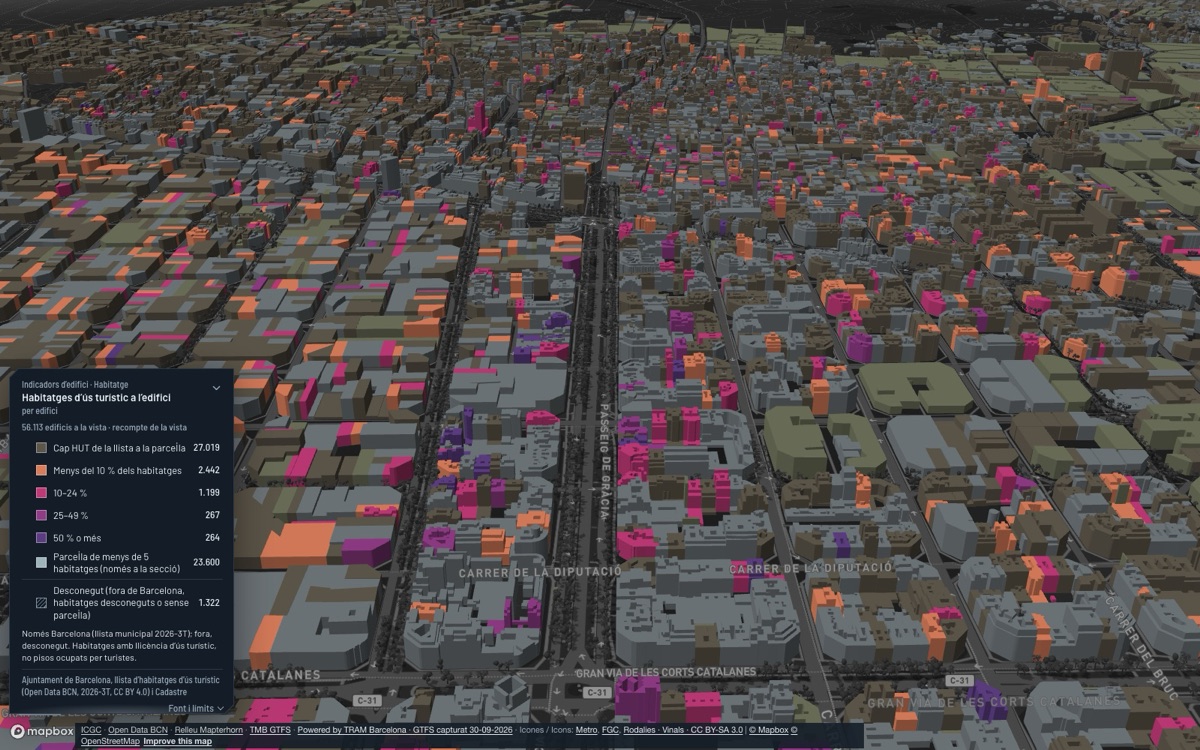
The Eixample at dusk with buildings painted by the share of tourist dwellings
Tourist dwellings · EixampleOfficialWhat share of each building’s dwellings are registered for tourist use, according to the municipal register.
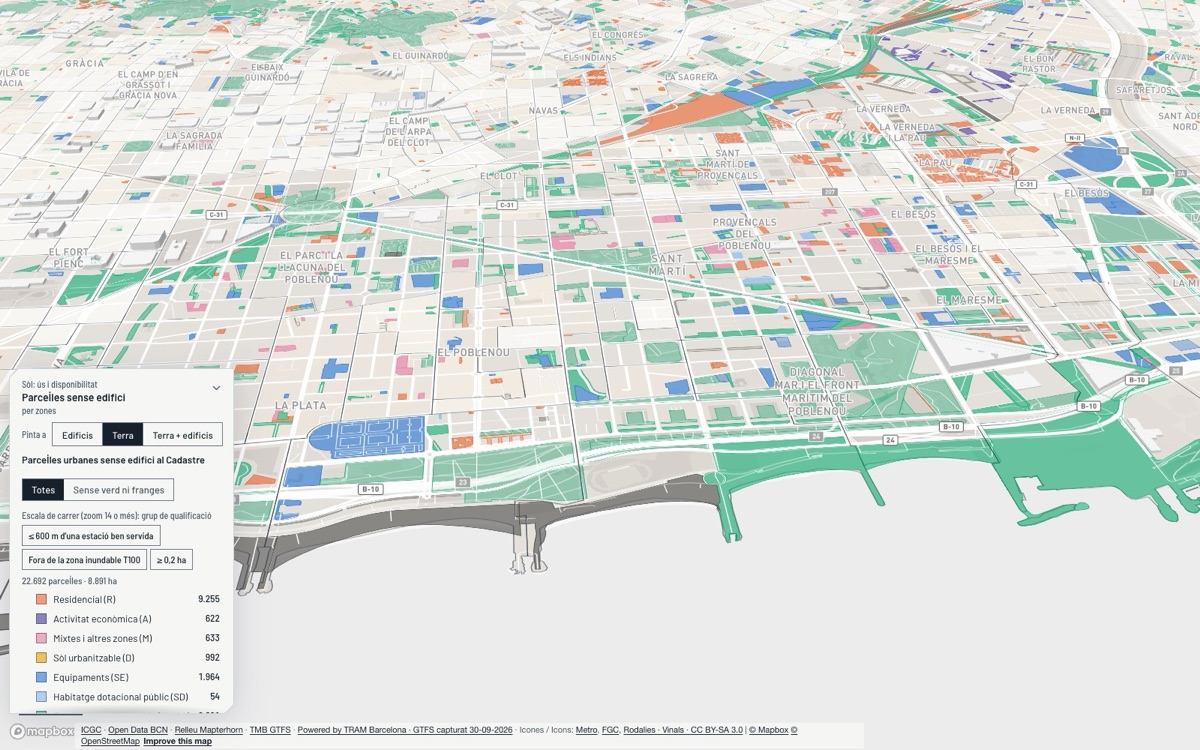
Poblenou and the Besòs with urban parcels without a building marked on the ground
Parcels without a building · Poblenou and the BesòsObservedUrban parcels with no building in the Cadastre, and what share of each section’s land they occupy.
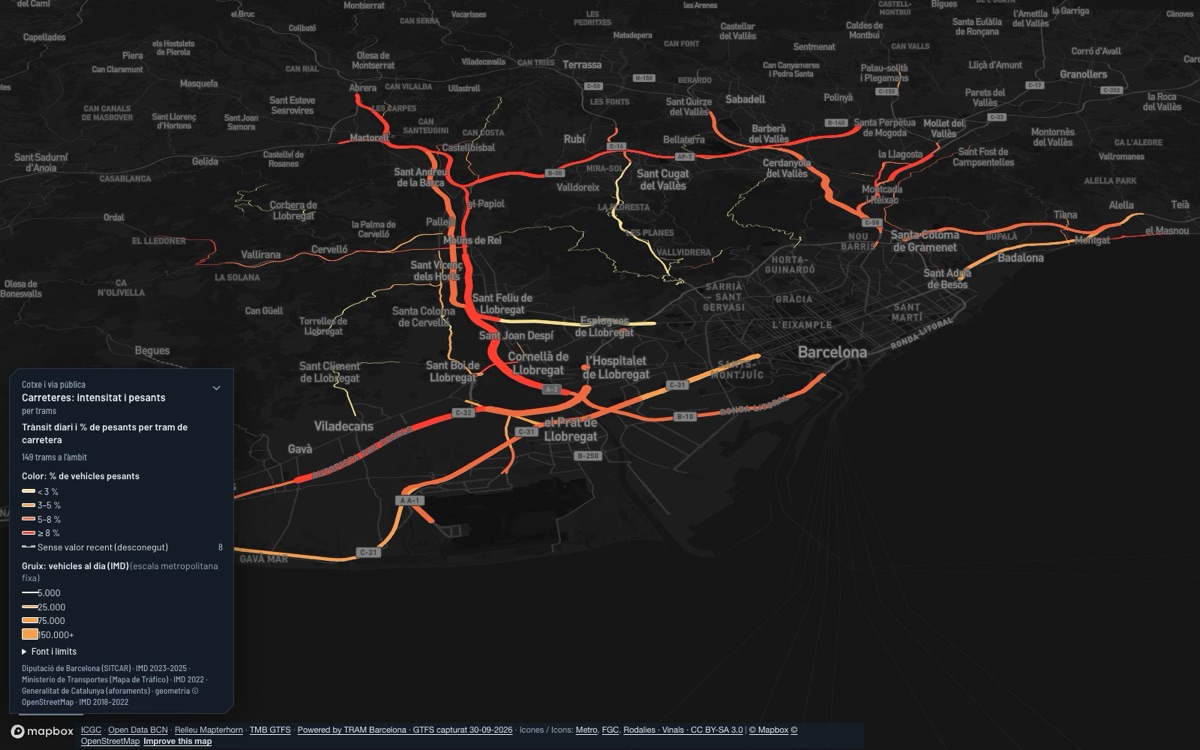
The port, the Zona Franca and the Baix Llobregat at dusk with road traffic
Road traffic · Port and Baix LlobregatObservedDaily vehicle intensity, and how many are heavy vehicles, on each counted stretch of the road network.

Underground

Beneath the street

Underground mode makes the city transparent and shows what lies below: metro and rail tunnels, stations, car parks and scheduled trains in motion. It follows the theme: x-ray by day in light mode, night in dark.

  • Scheduled, not real position: trains move according to the published timetables (GTFS), not where they are now.
  • For works: before opening a trench, what runs beneath the stretch.
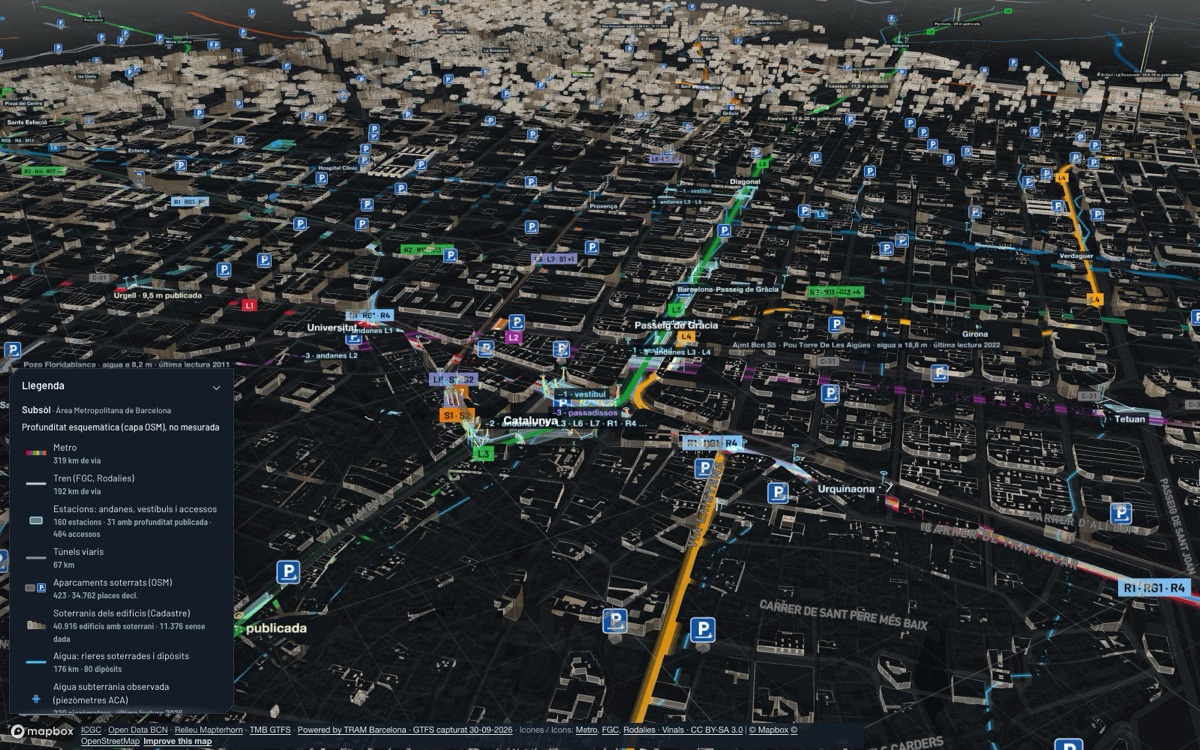
Underground central Barcelona at night, with metro, rail, stations, car parks and basements
ContextUnderground central Barcelona at night: metro, rail, stations, car parks and basements. Schematic depth, not measured.

Metropolitan scale

The whole AMB at a glance

The flow and municipality views open at metropolitan scale: the commuting arcs join where people live and where they work or study, and the thickness says how many people make each trip.

ObservedCommuting arcs between AMB municipalities, 2023 census. The animation is illustrative: these are not real journeys.

Two engines, the same figures

The new engine is the default, but not the only one. The figures, counts and sources are the same in both: only the drawing changes.

Mapbox GL JS, by default

Façades, landmarks, trees and daytime or dusk light. On phones and modest computers a light mode with no trees or façades switches on, so the map stays smooth.

MapLibre, as a fallback

The open engine from before stays inside the viewer: for embeds, automated tests and when the new engine is not available. You can pick it under “Map options”.

The data stays ours

The engine supplies the volumes and the context; the colour of each building, the legend, the counts and the source of each figure come from the official data the viewer publishes, with date and limits.

Want to see it with your own questions?

The viewer is in private beta. Request access and we’ll give you a login to try it on your own municipality.