Read the city, measure it and test changes.
Xamfrà is a digital twin of the 36 municipalities of the Barcelona metropolitan area. One question at a time, from the whole AMB down to a building or a street, with the source, the year and the limits of every figure, and every scenario marked as a scenario.
The viewer is in private beta. Request access and we will give you a user account to try it with your own questions. Already have a login? Enter the viewer.

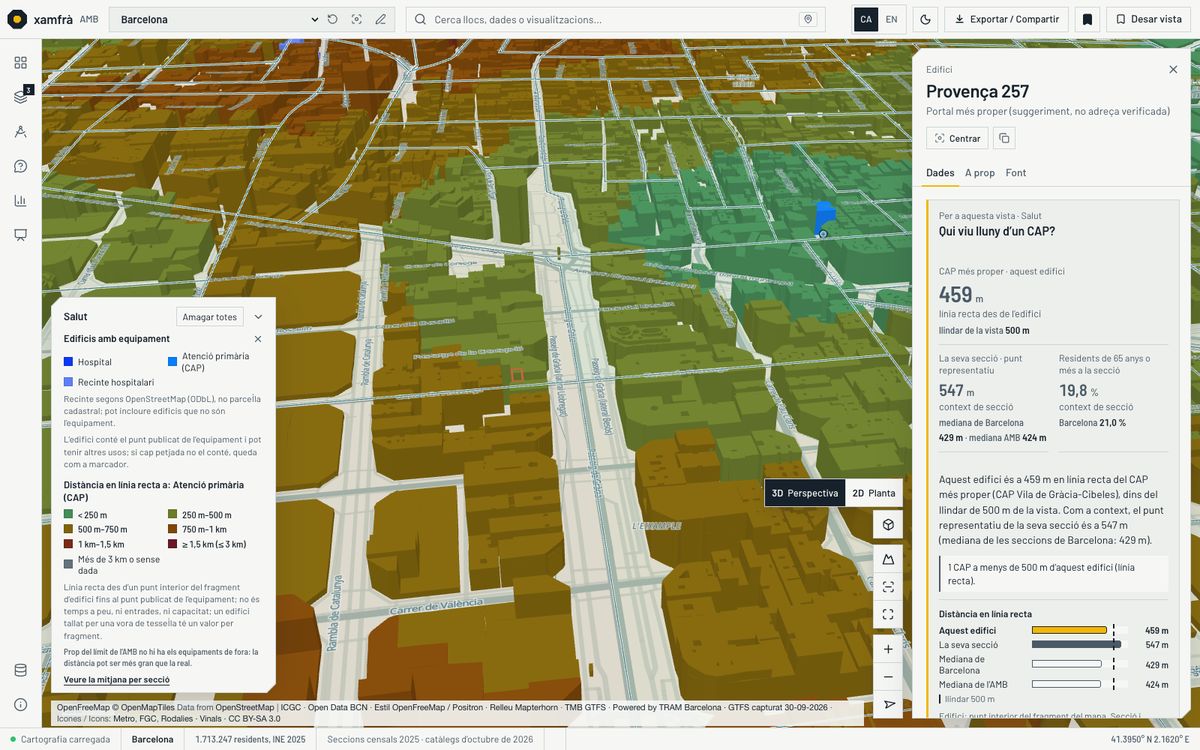
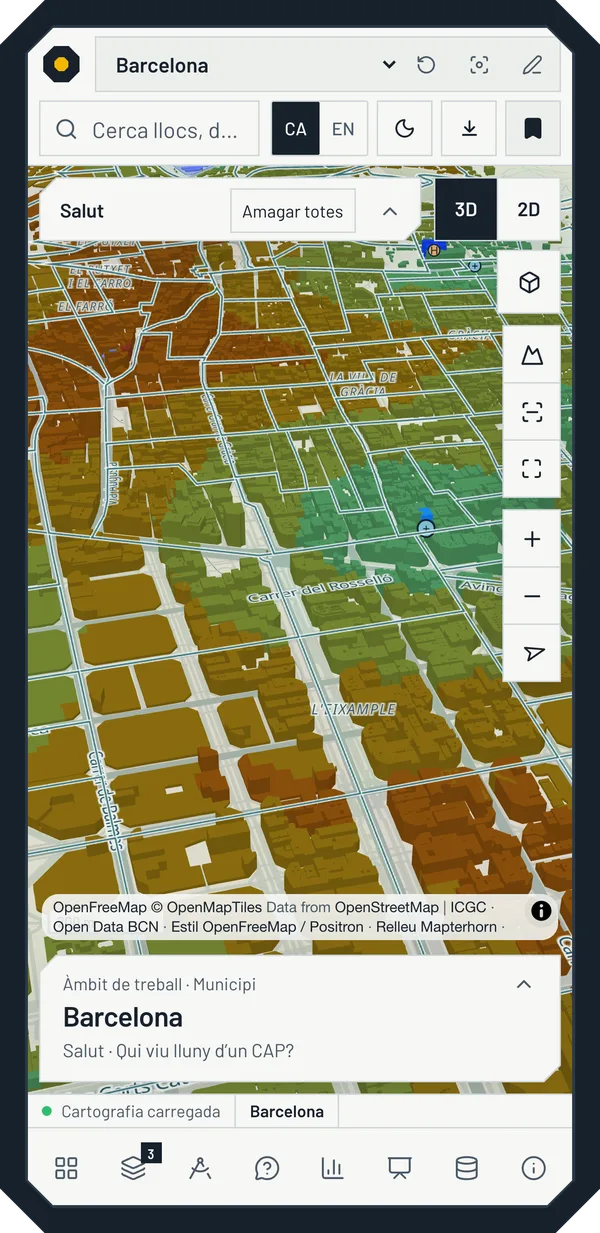
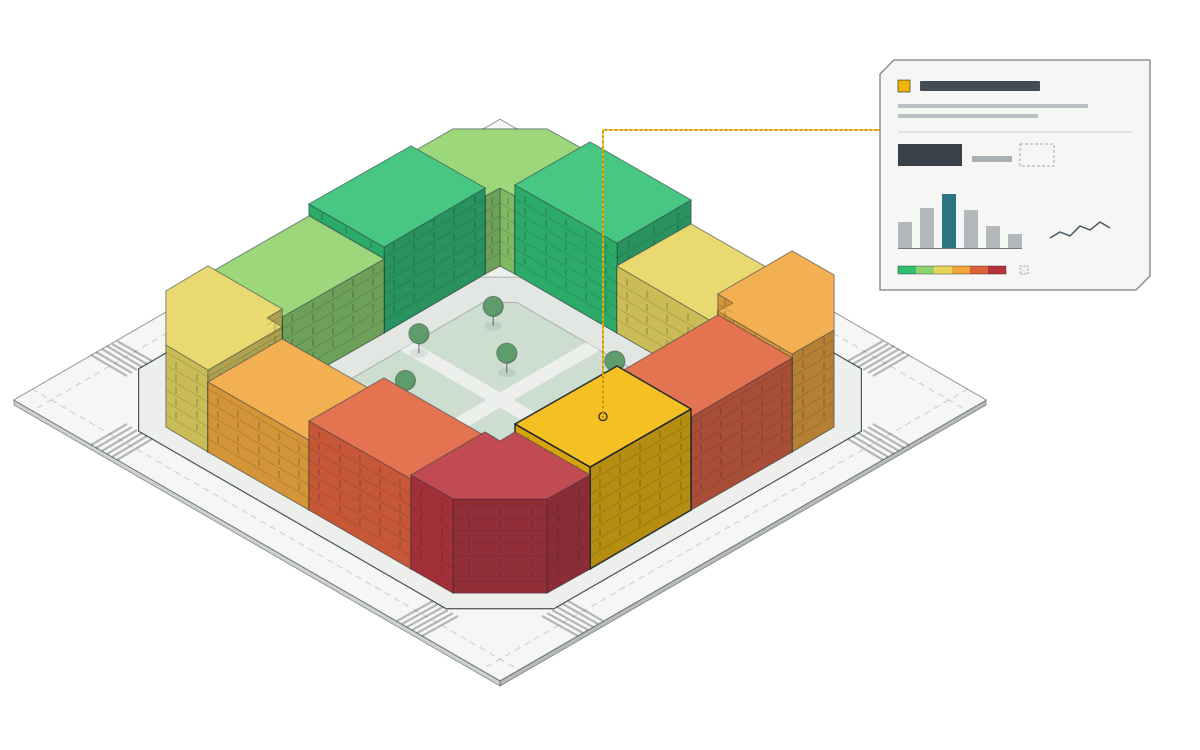
Who lives far from a CAP? Each building in Barcelona takes the colour of its straight-line distance to the nearest CAP (primary care centre): green if close, red if far. It is not walking time. Facilities catalogue, October 2026.
- 36 AMB municipalities
- 2,151 census sections 2025
- 3,449,761 residents, INE 1 January 2025
- 192 thematic views
- 33 planning tools
- also in Madrid and New York
New 3D engine · October 2026
The same city, in new 3D.
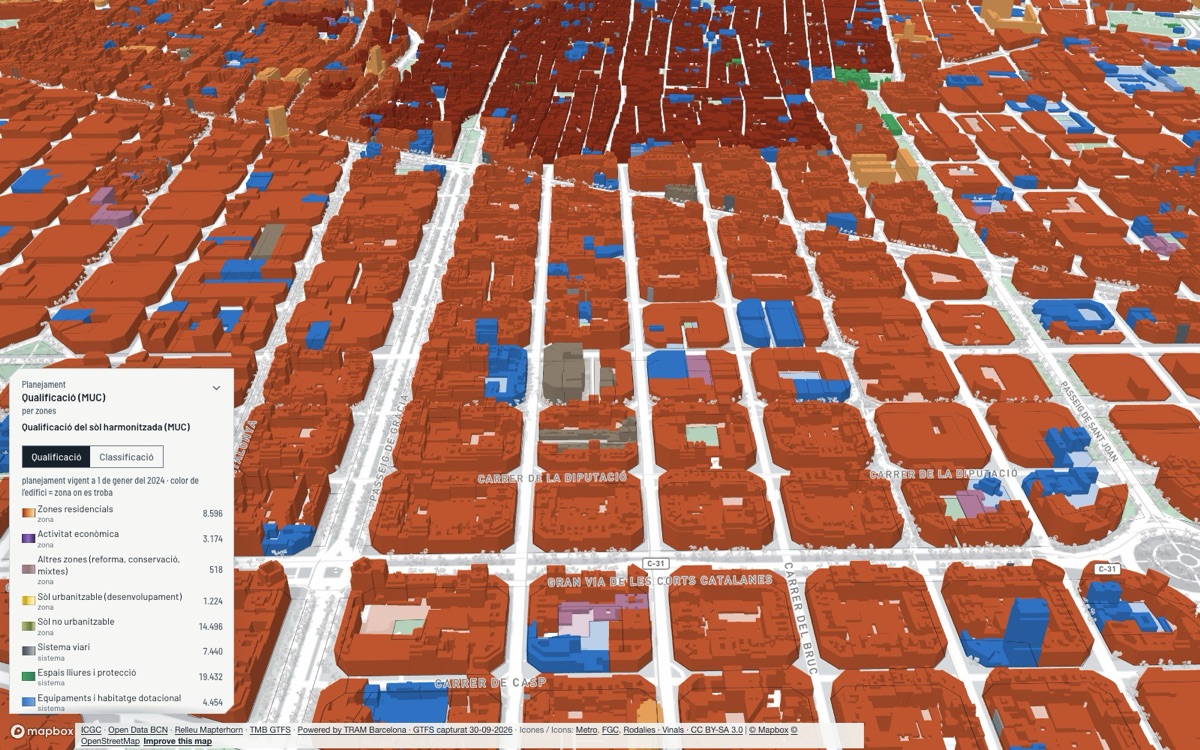
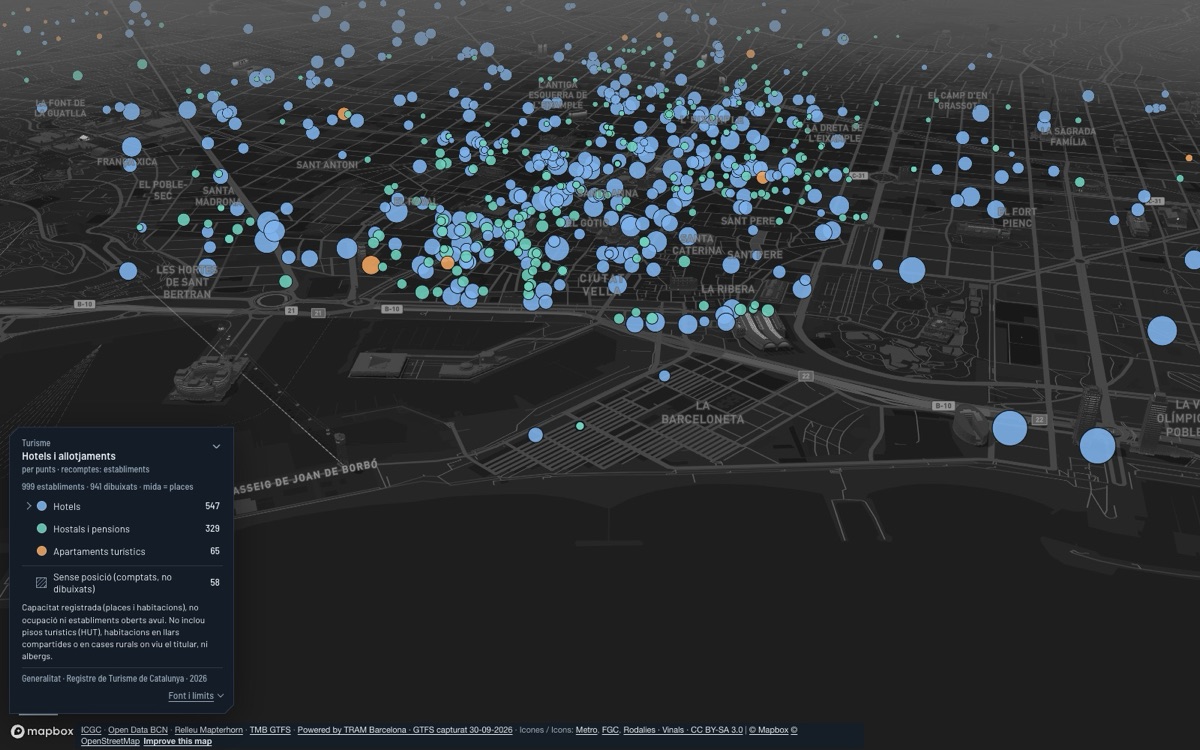
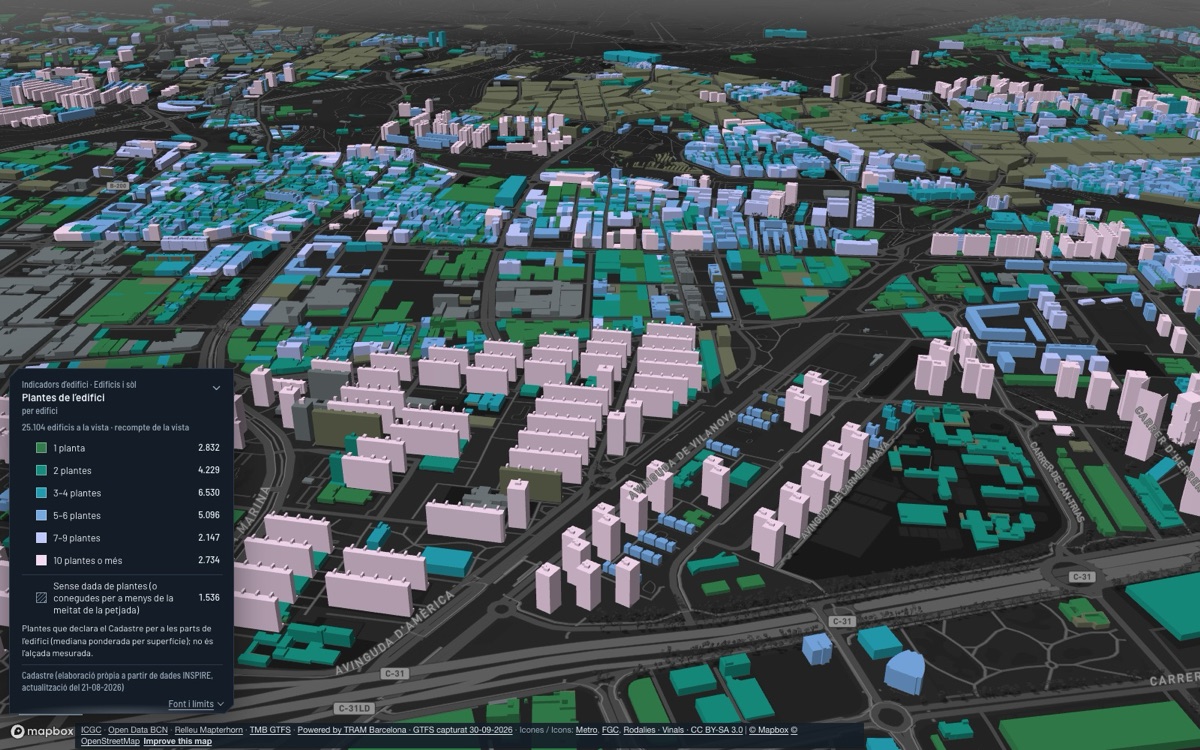
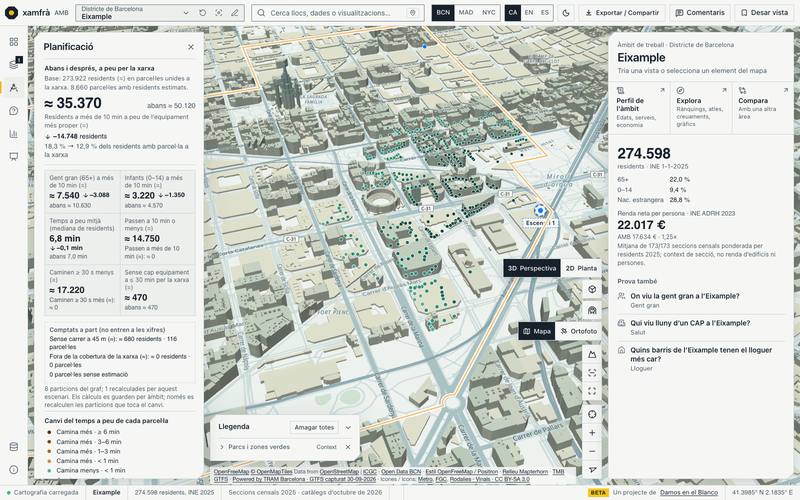
Façades, landmarks and trees; daytime or dusk light; and every building painted with the answer to the question. The data, the sources and the limits are the same. Recorded in the viewer, unretouched.
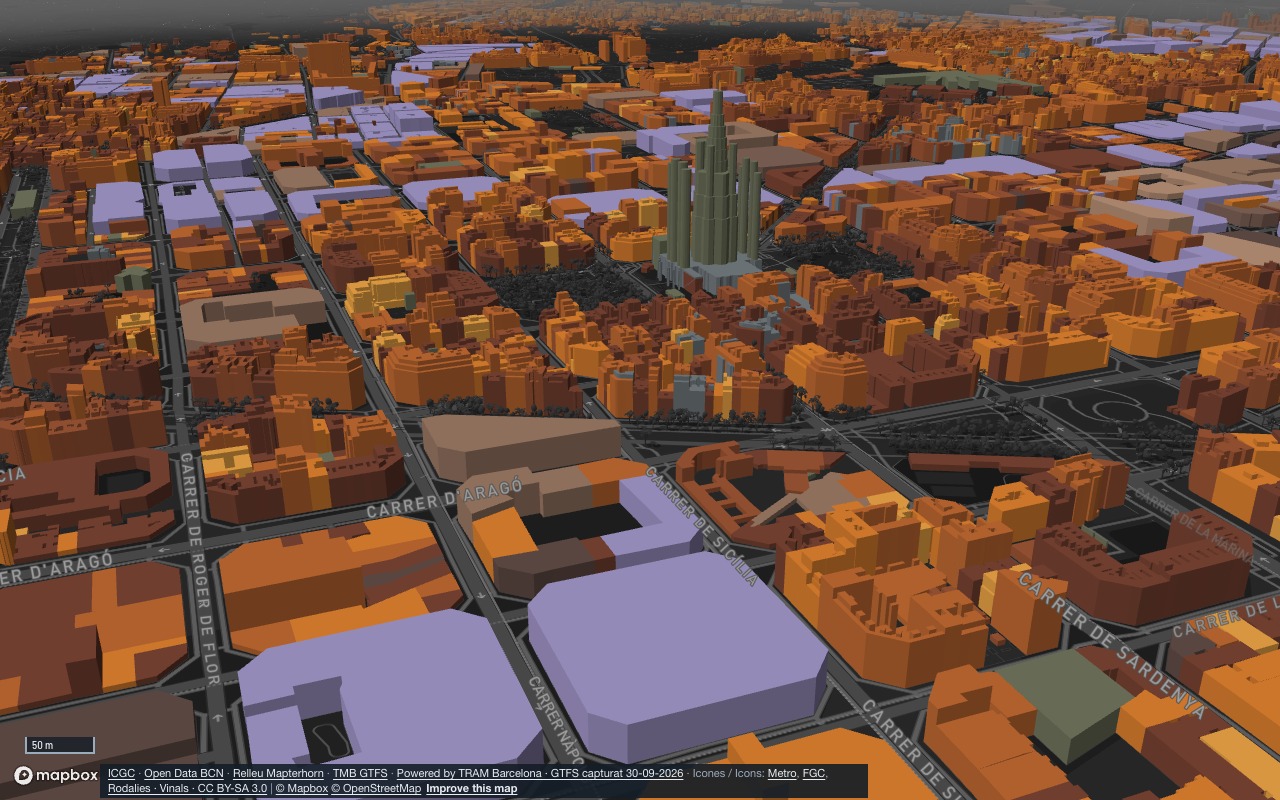
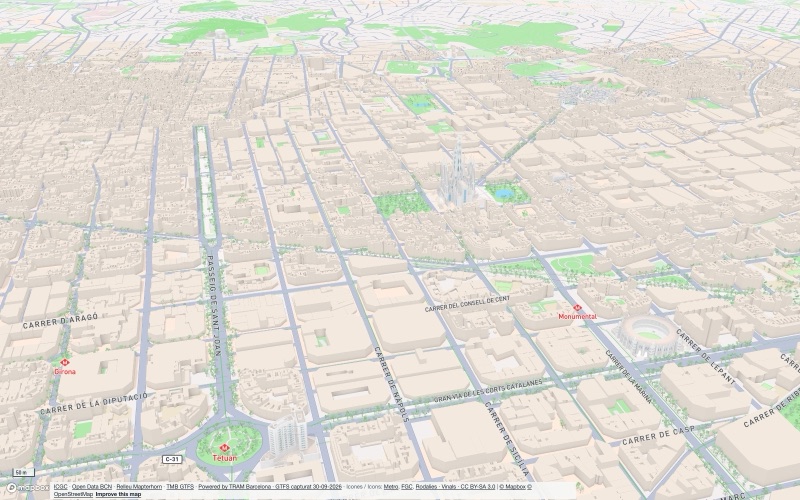
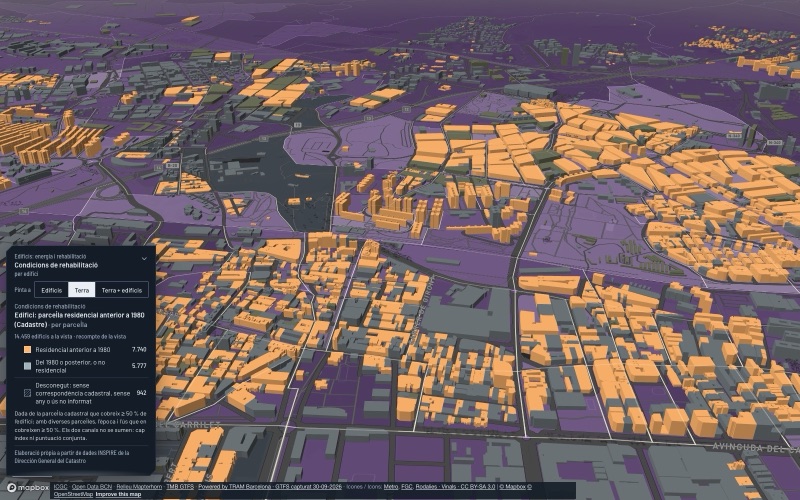
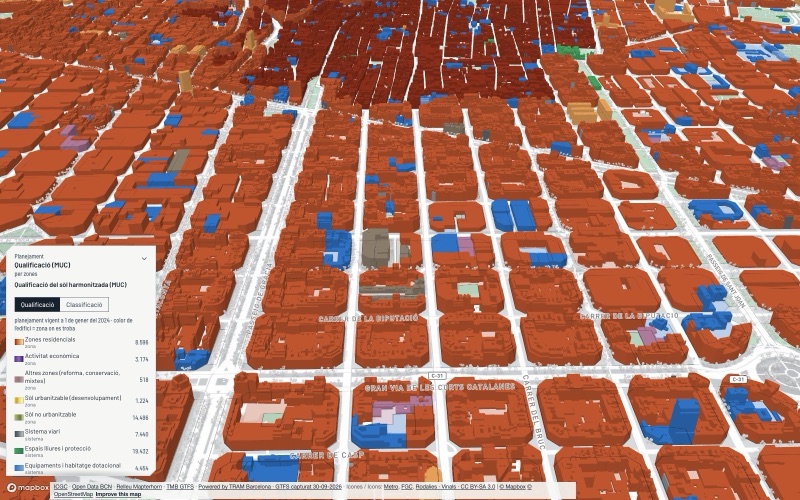
192 views, one question each
All of them, by theme →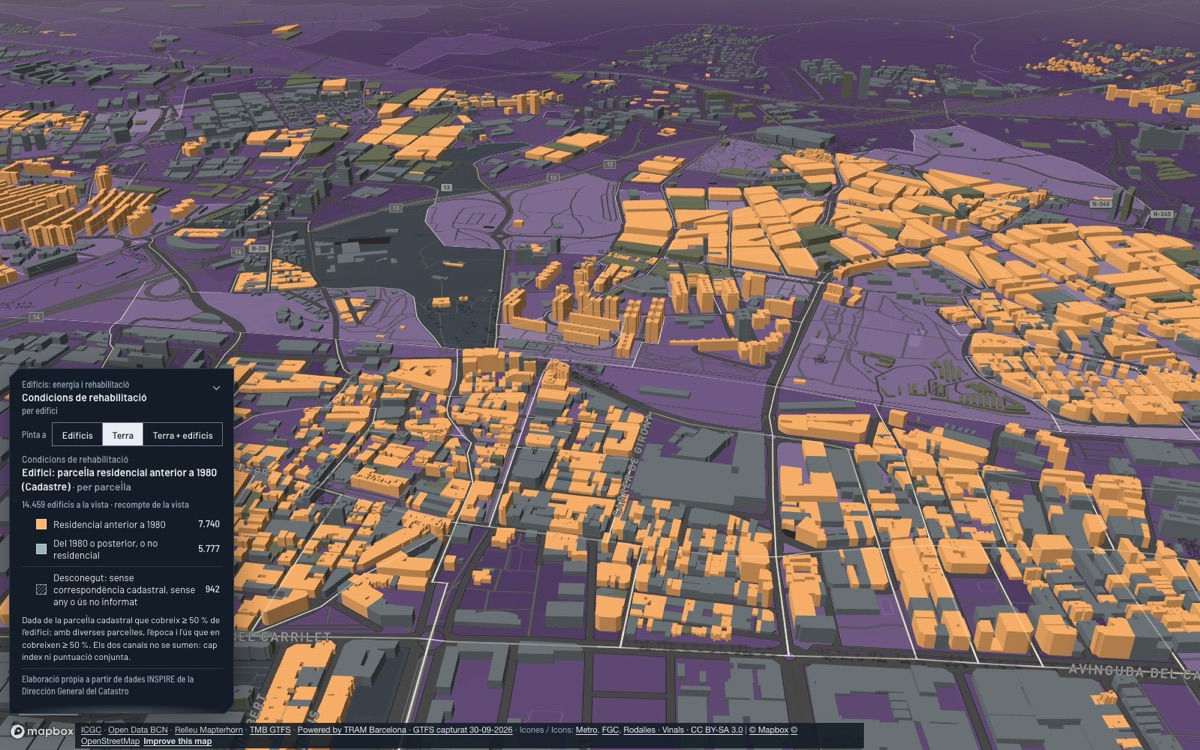
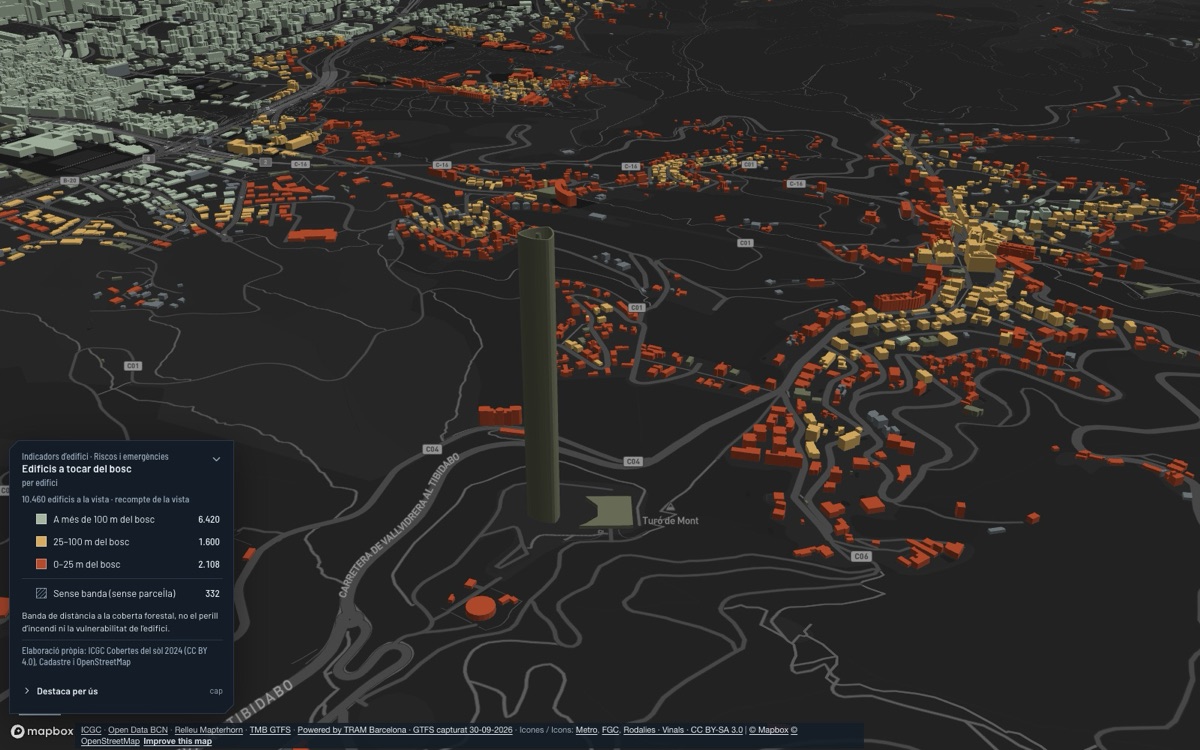
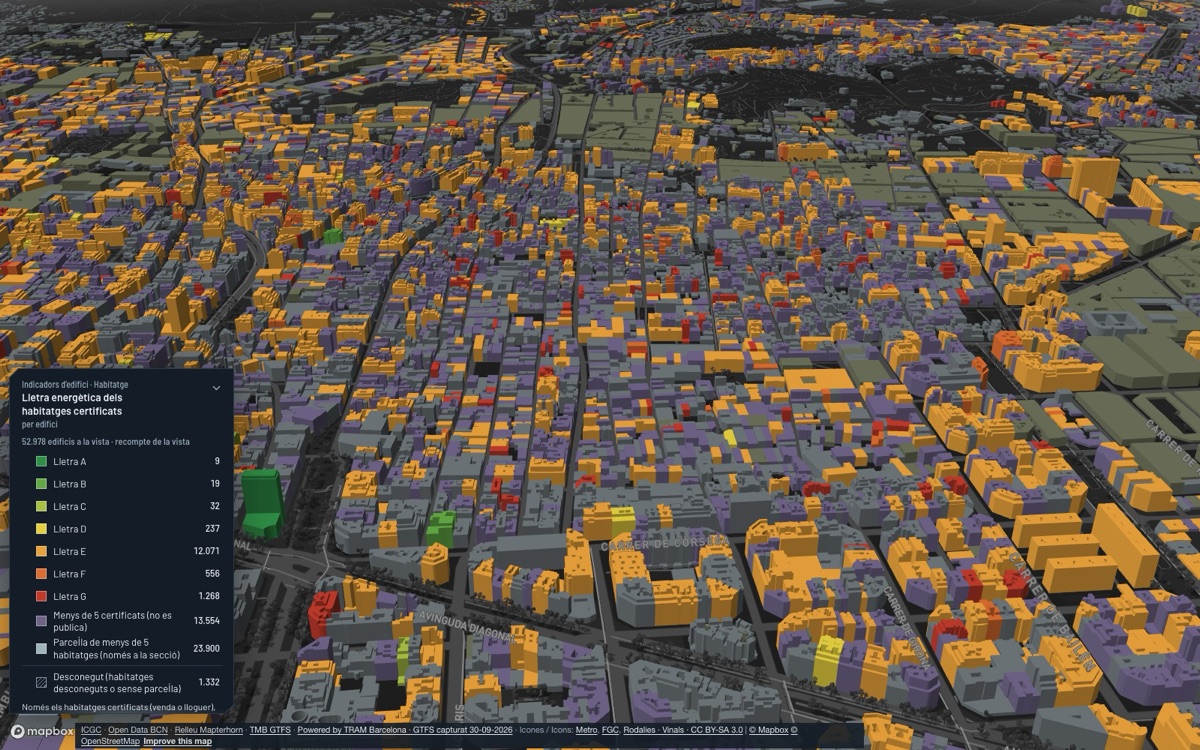
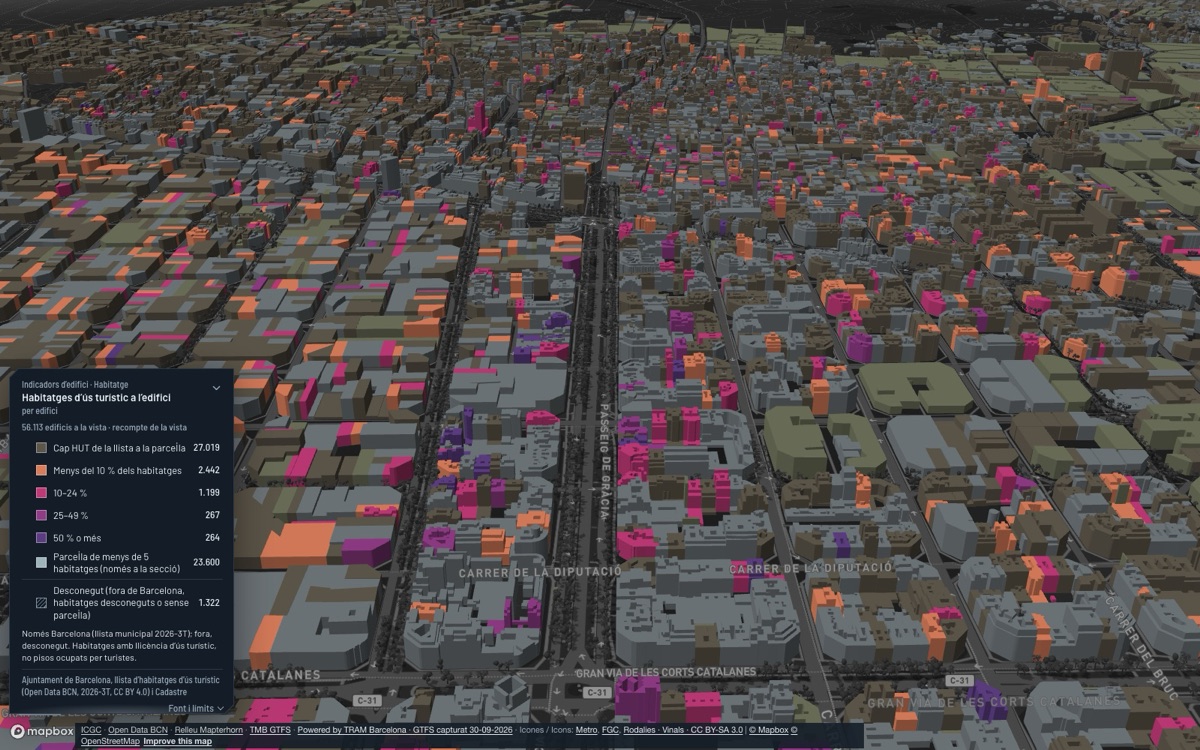
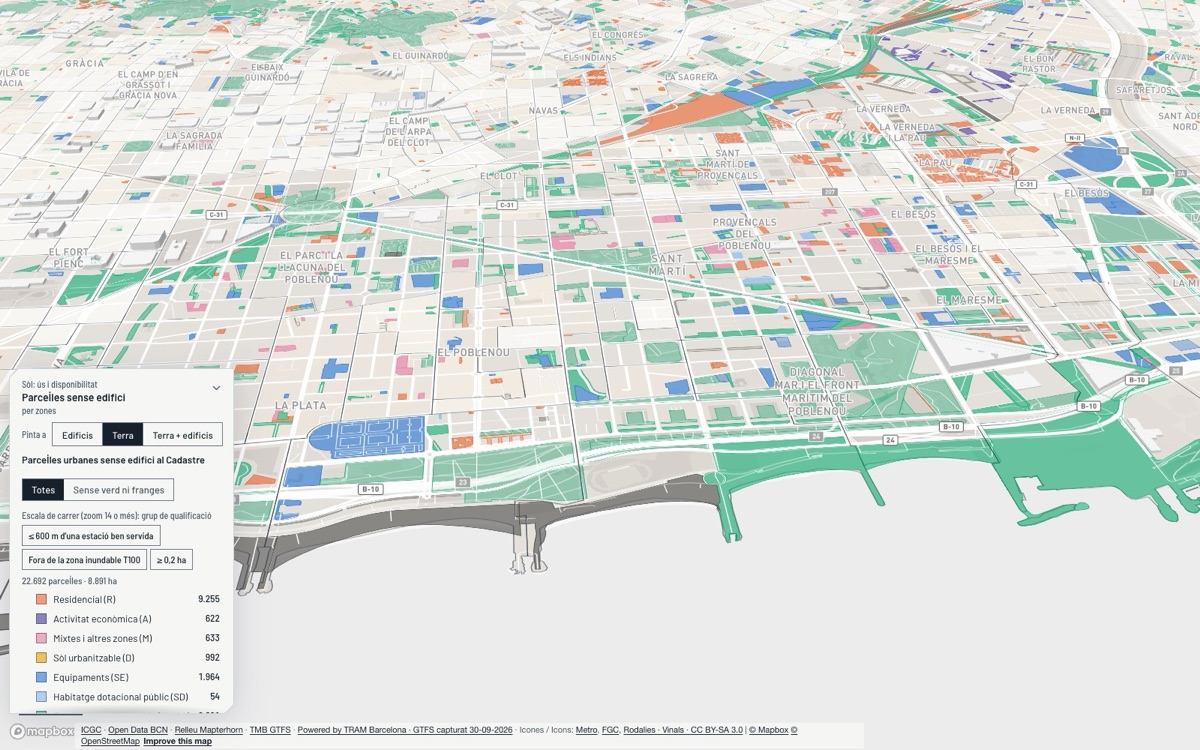
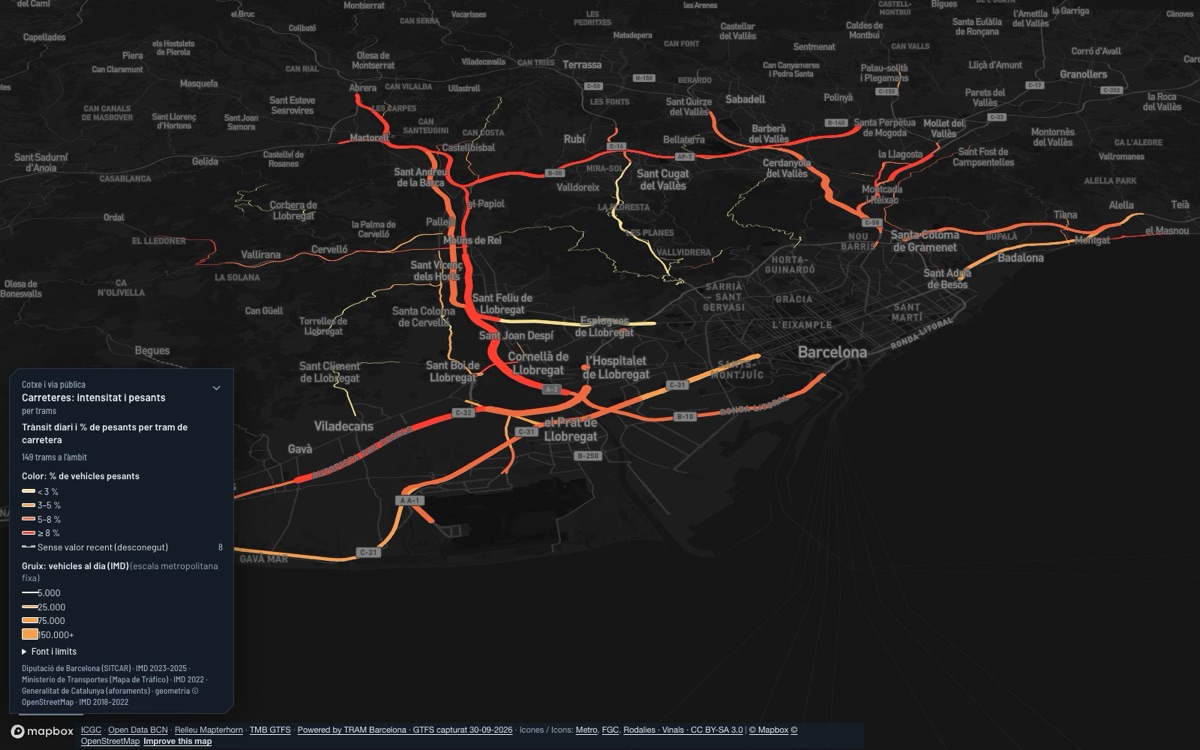
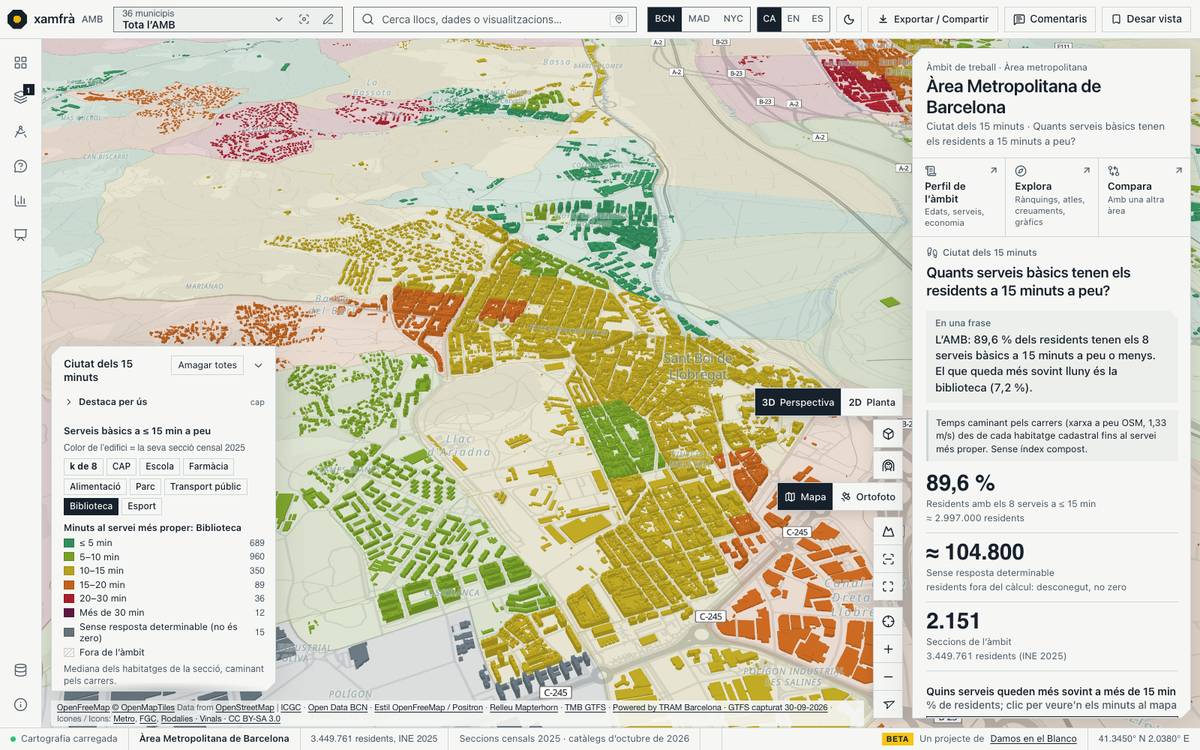
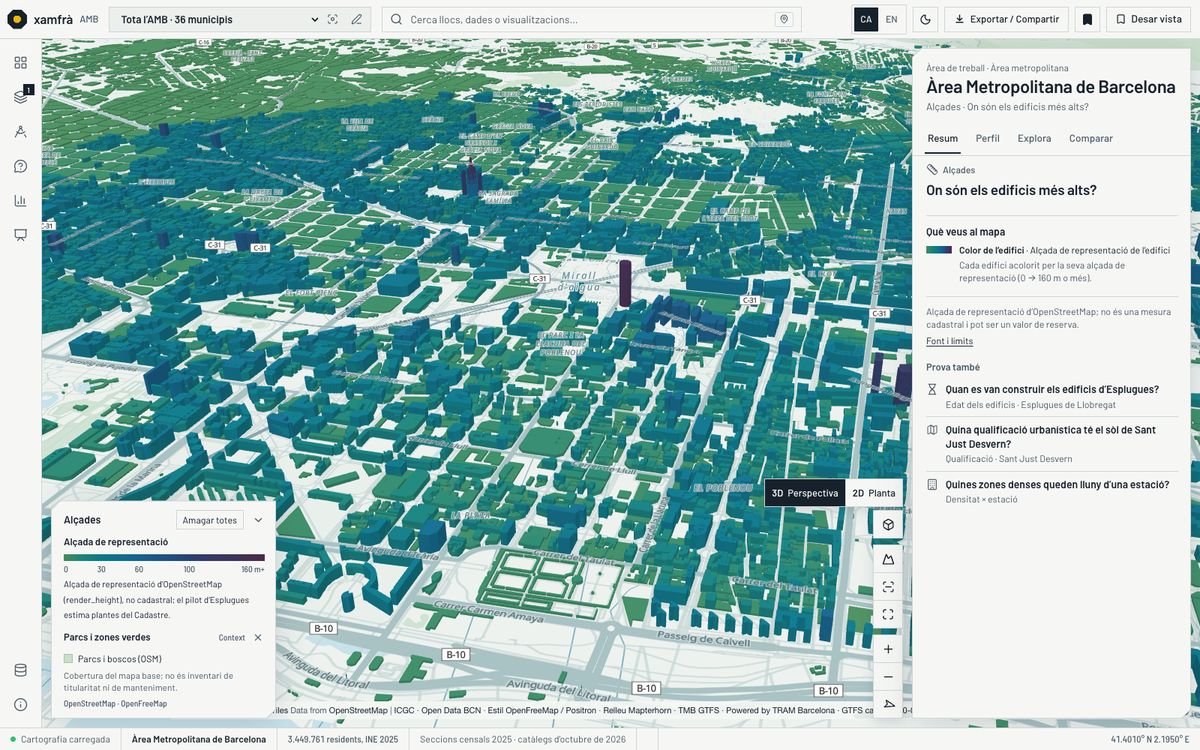
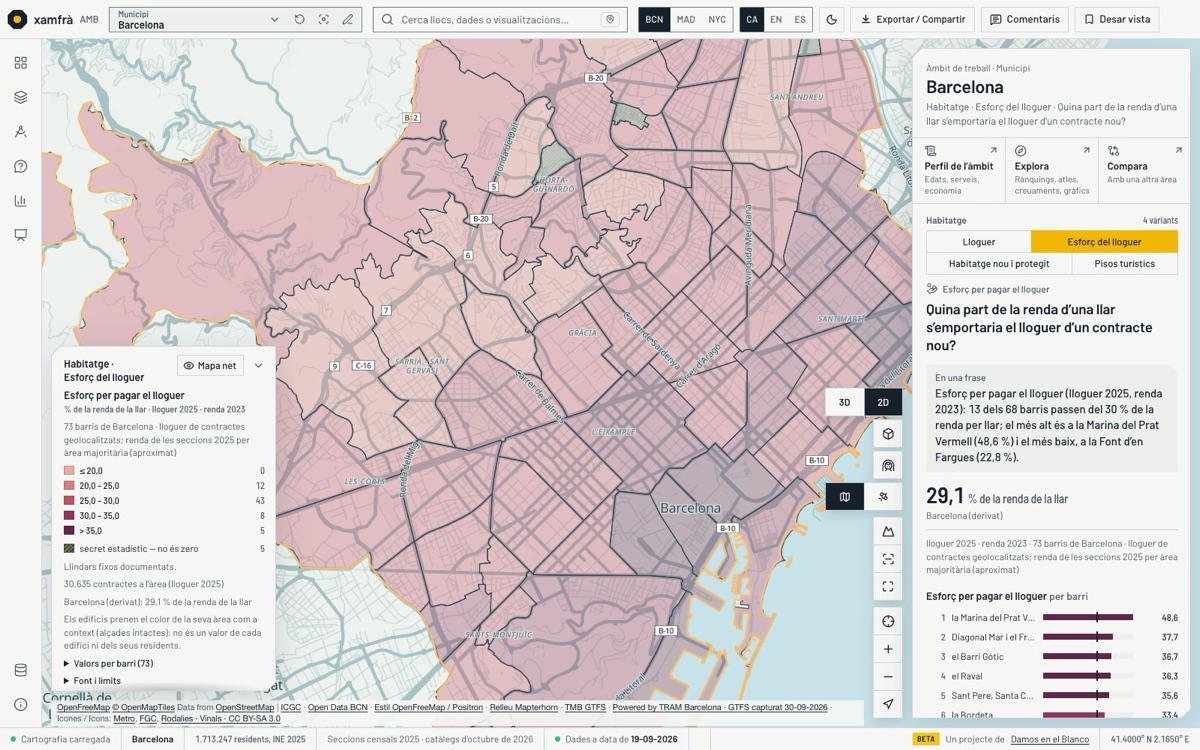
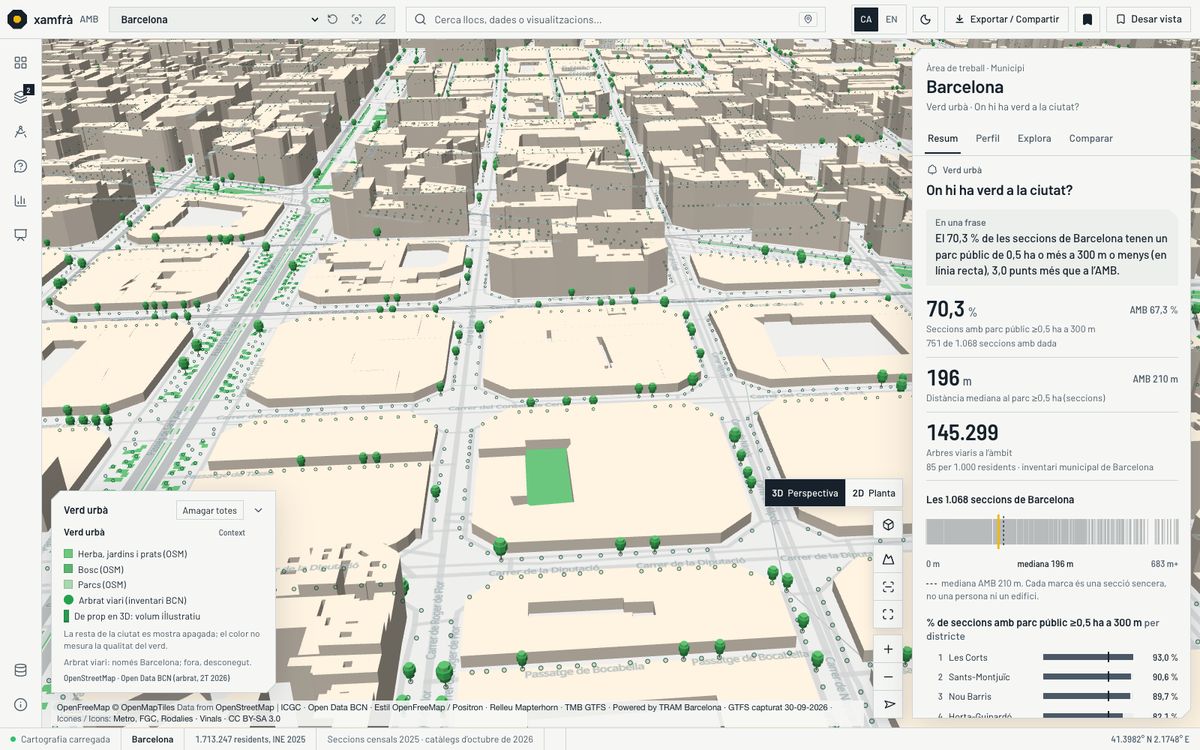
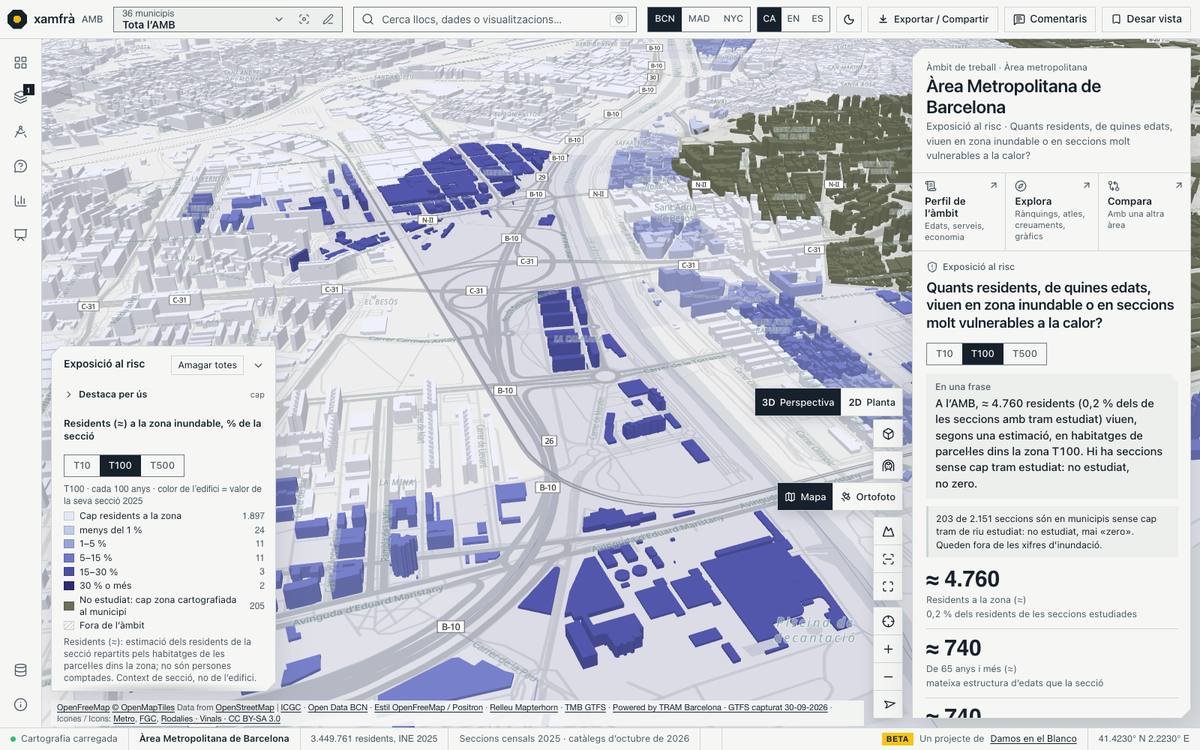
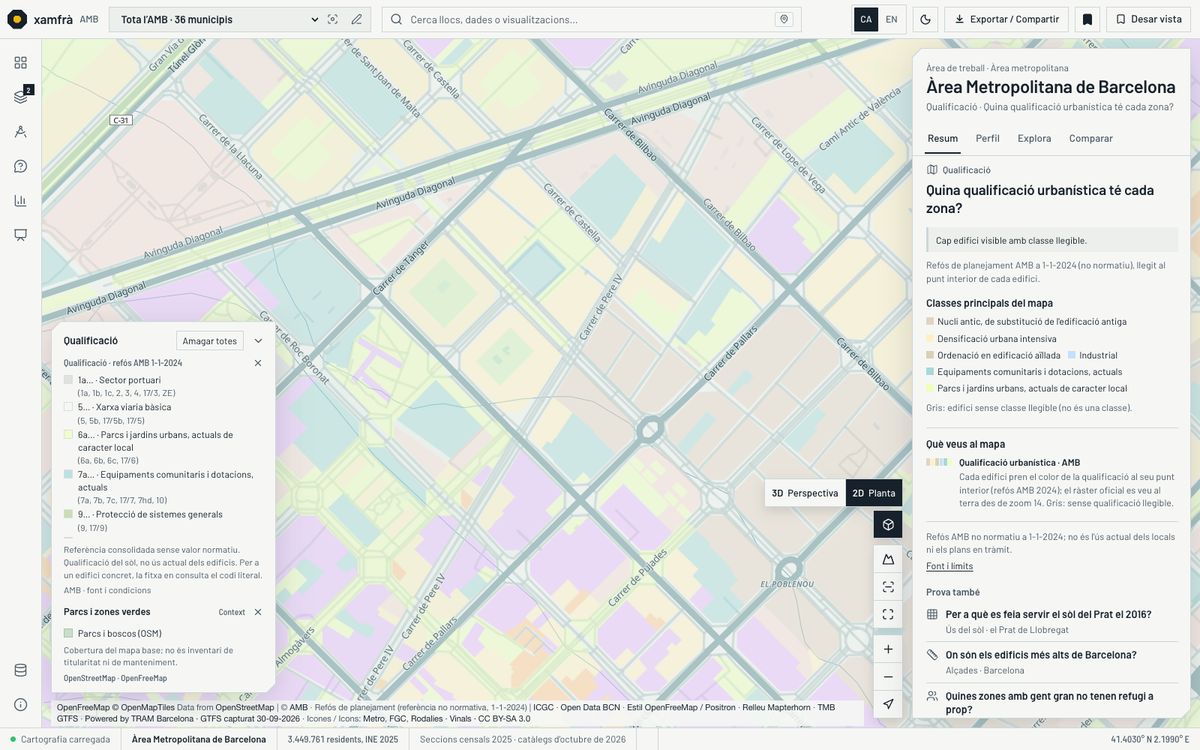
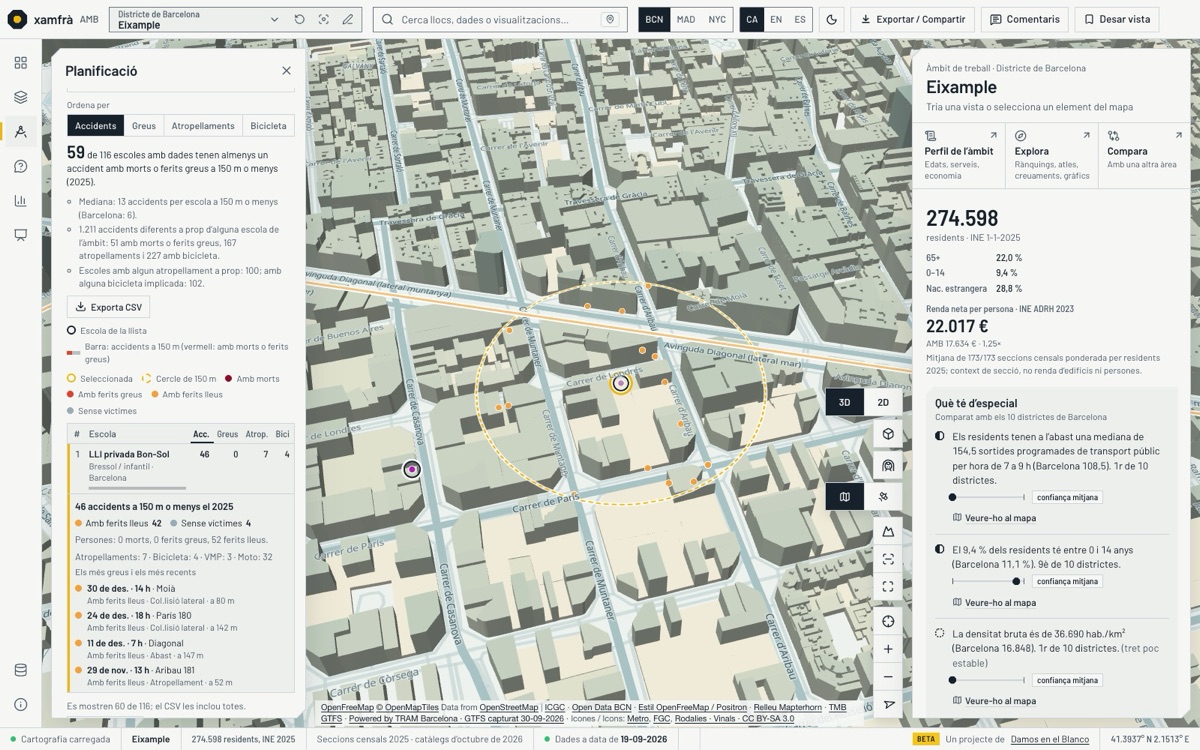
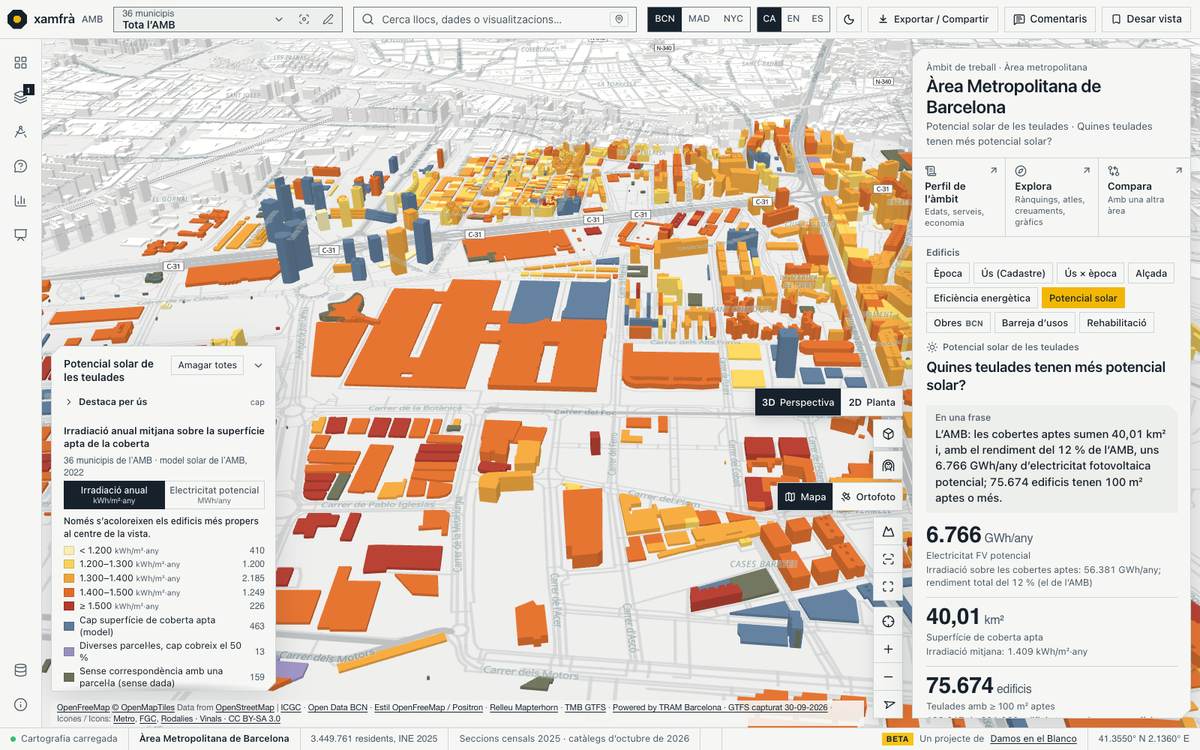
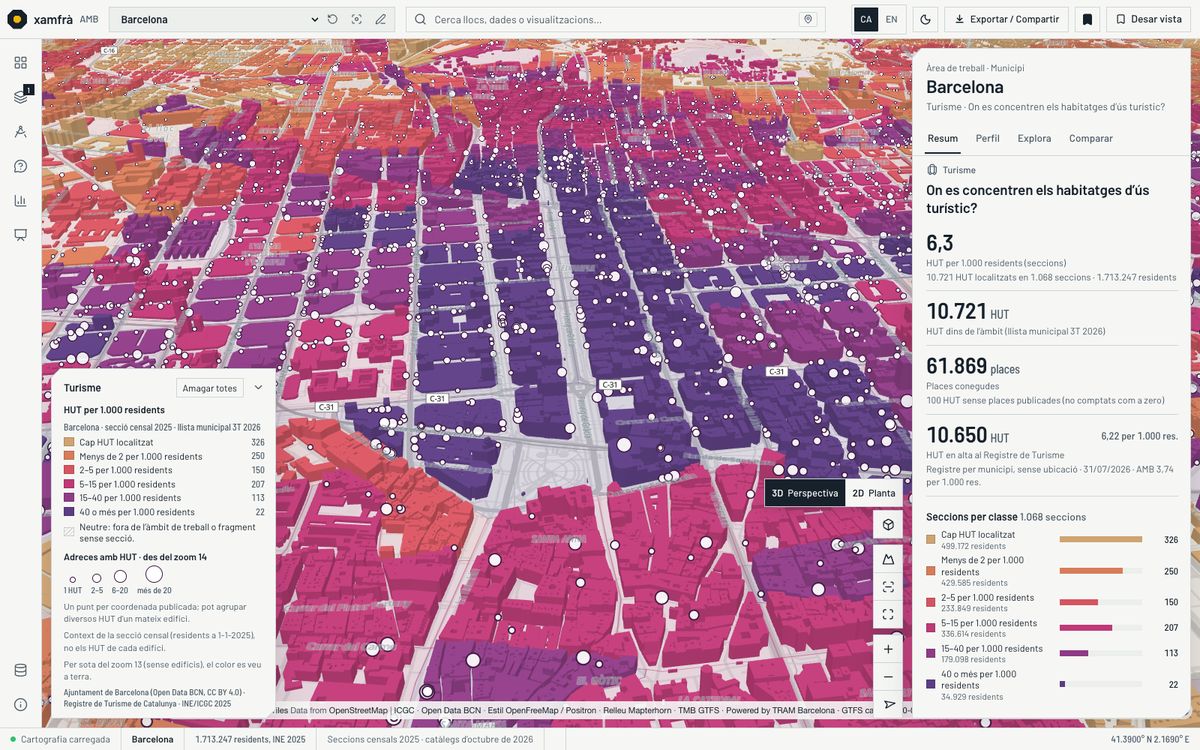
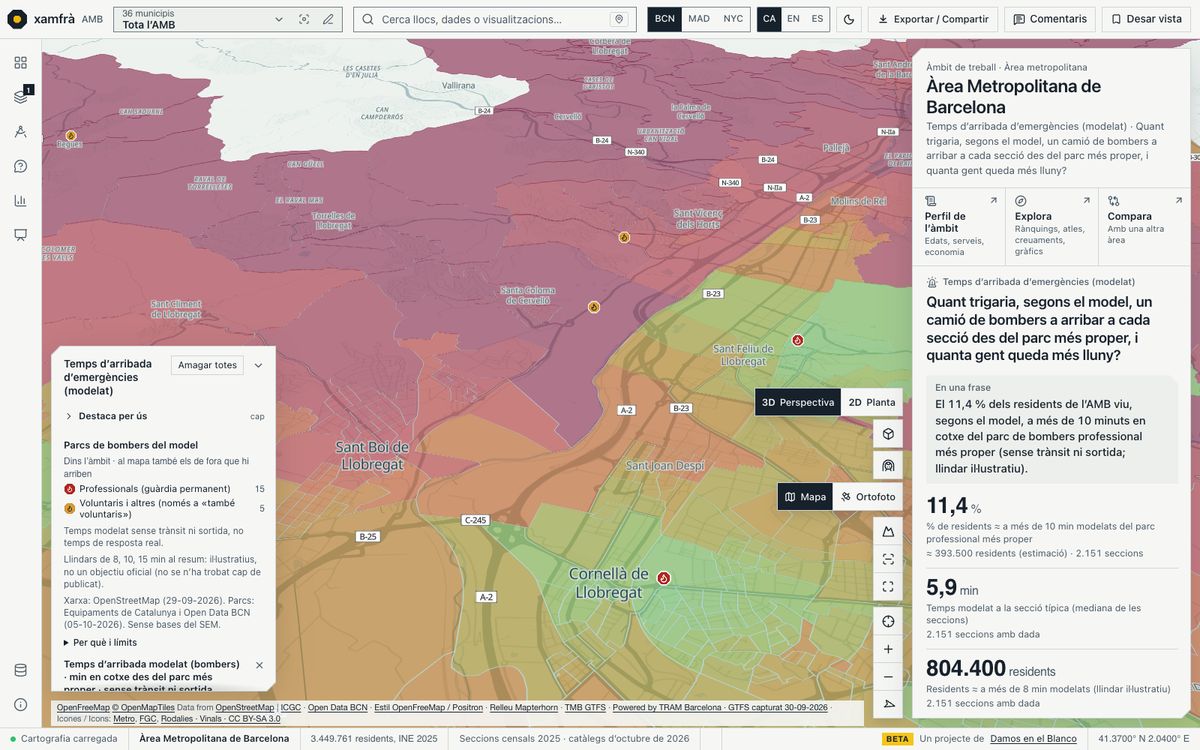
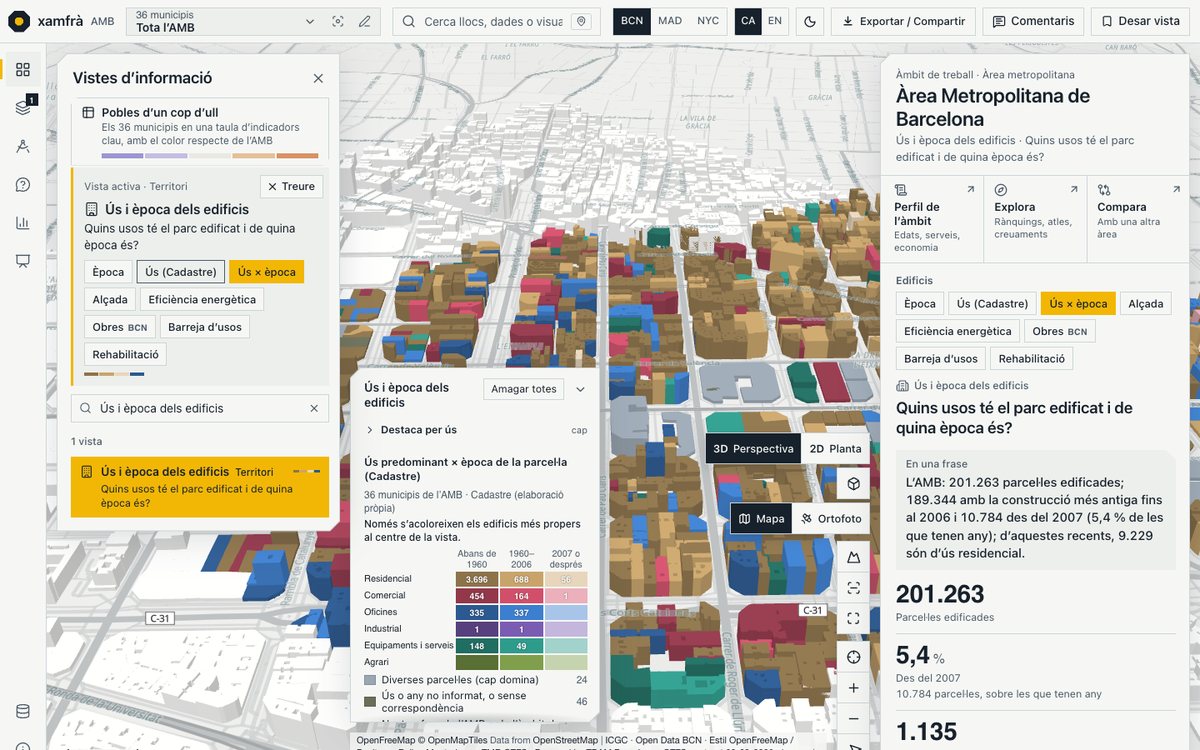
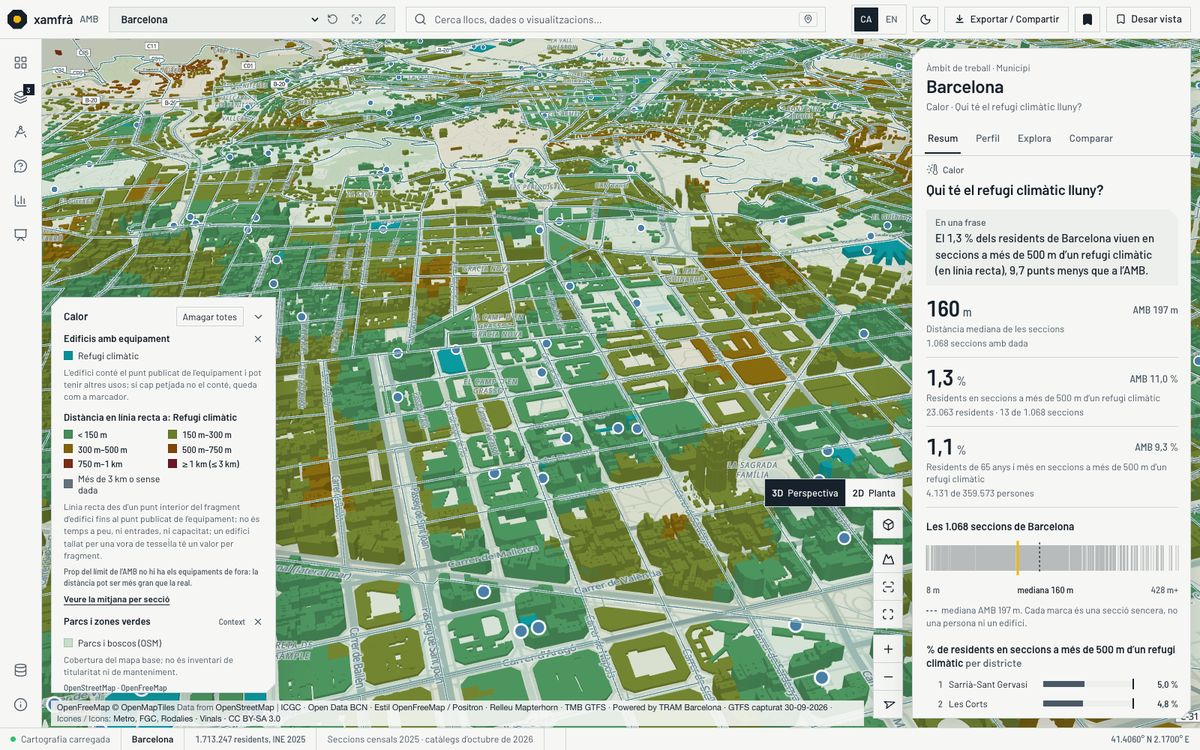
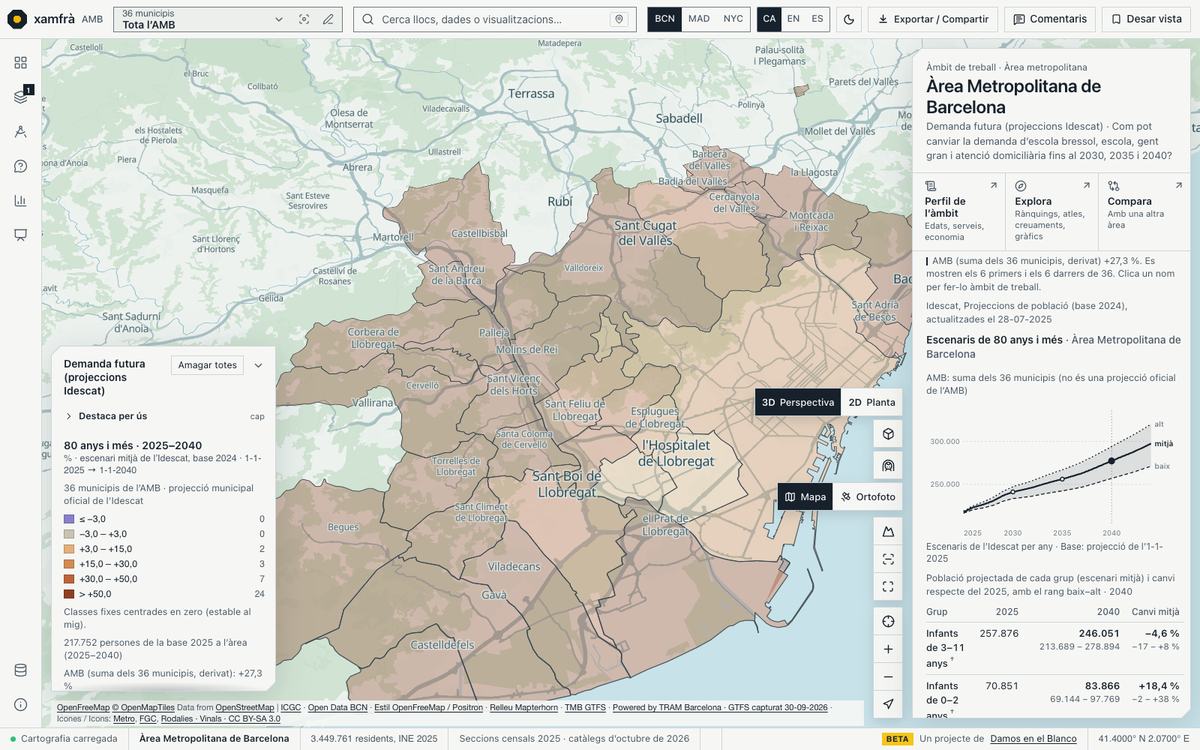
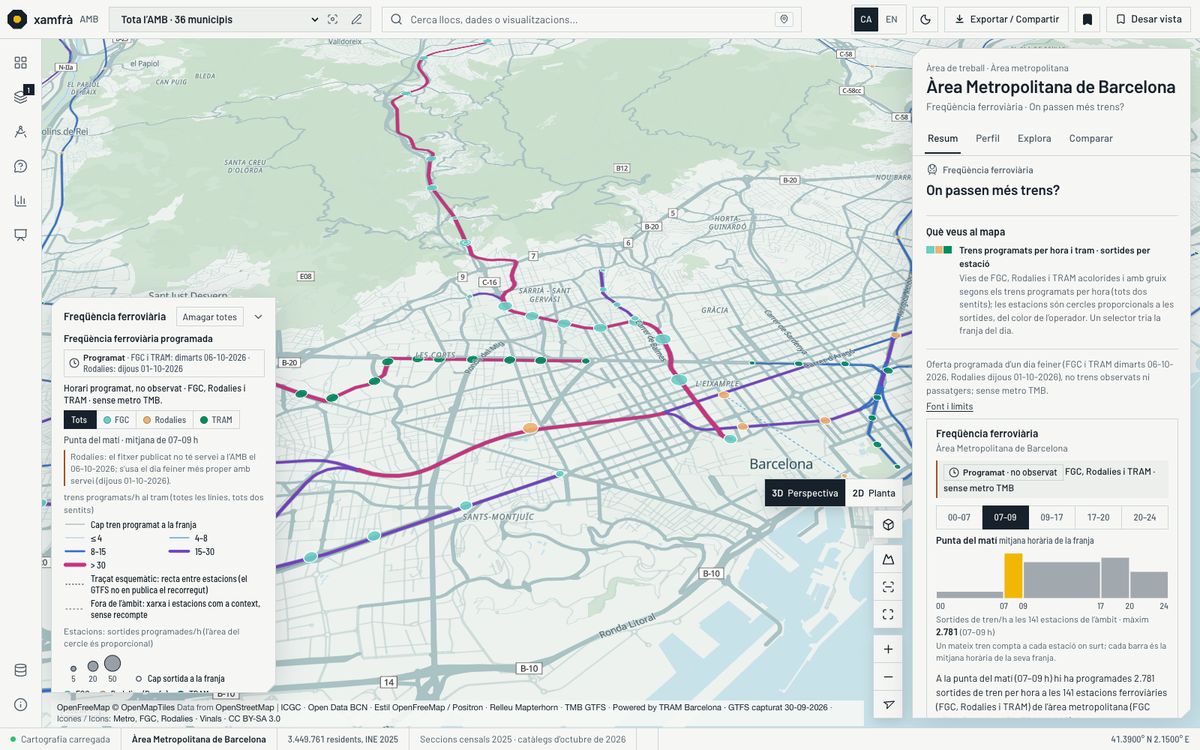
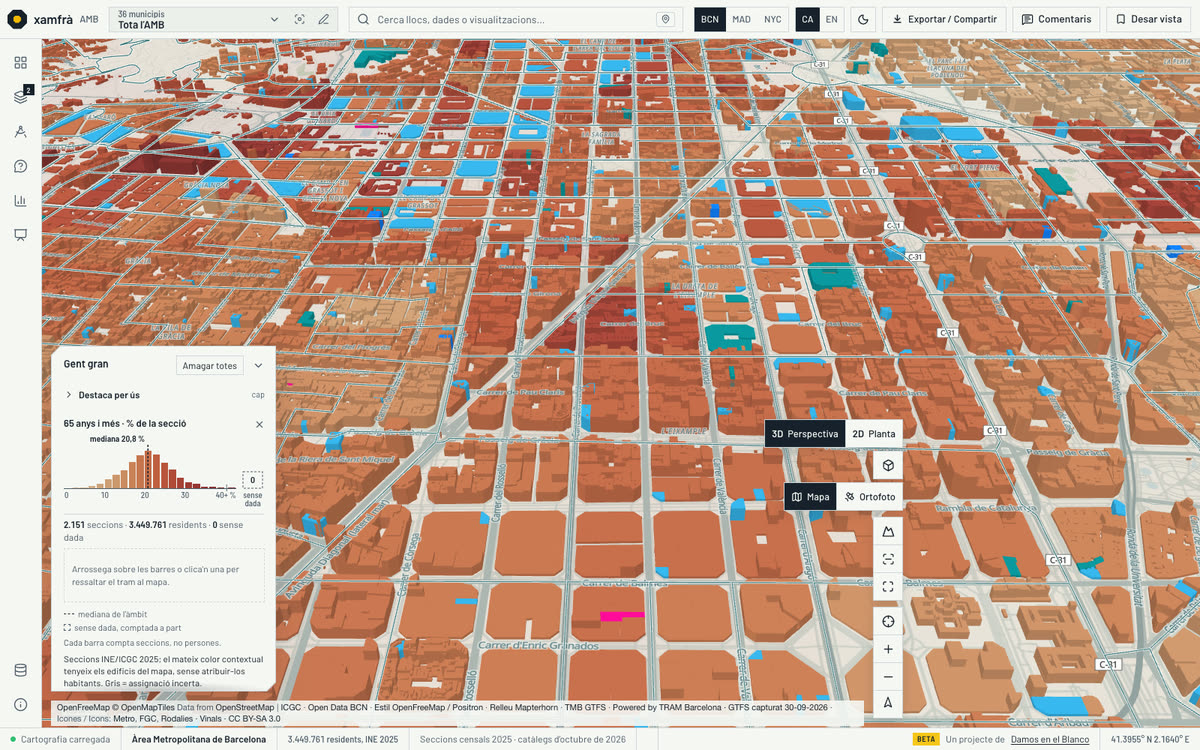
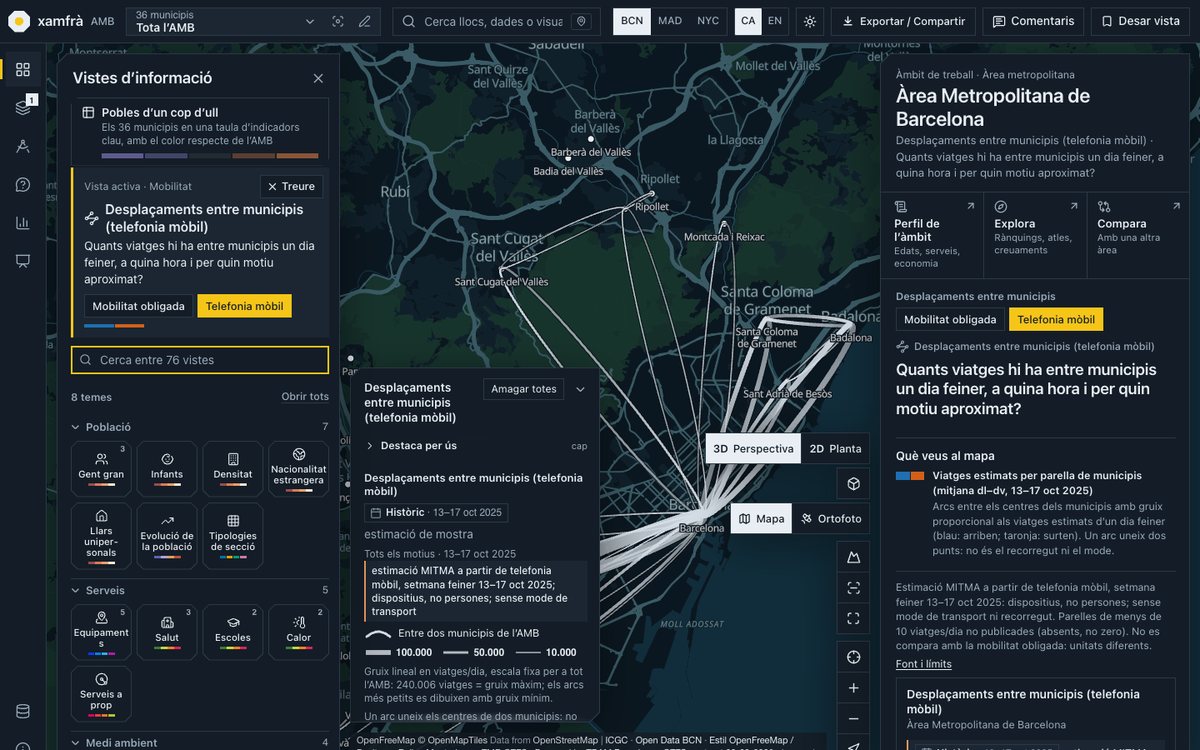
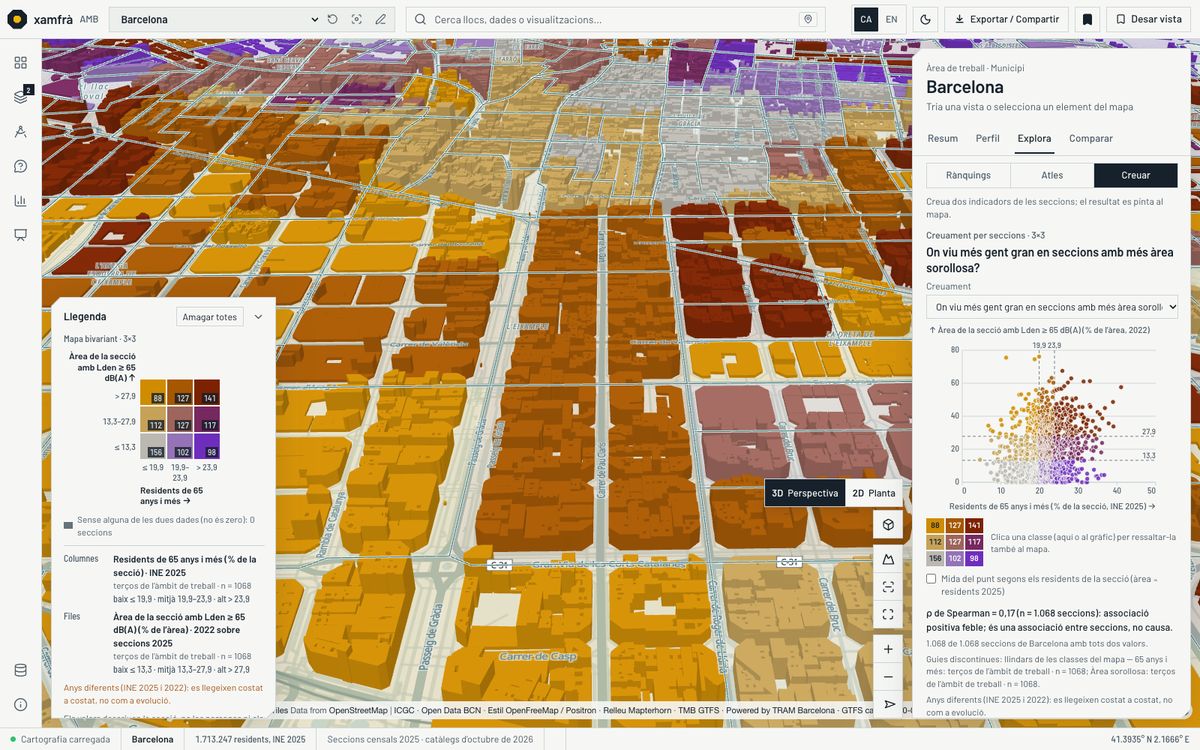
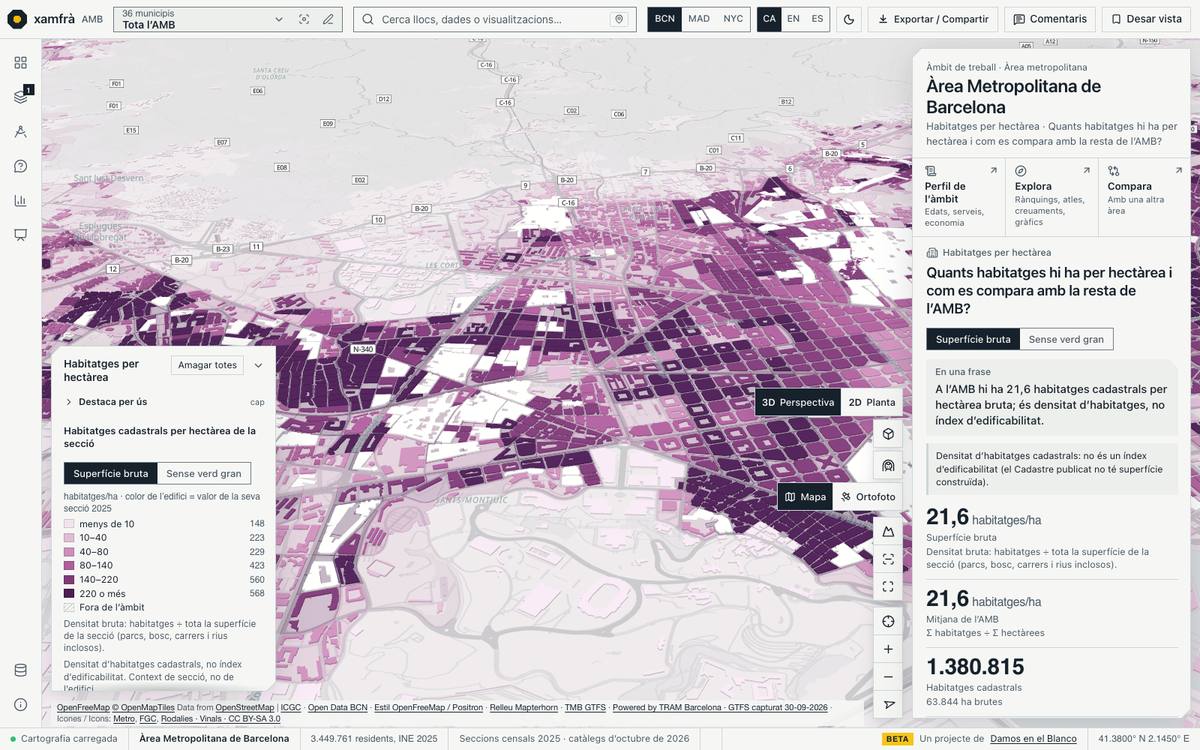
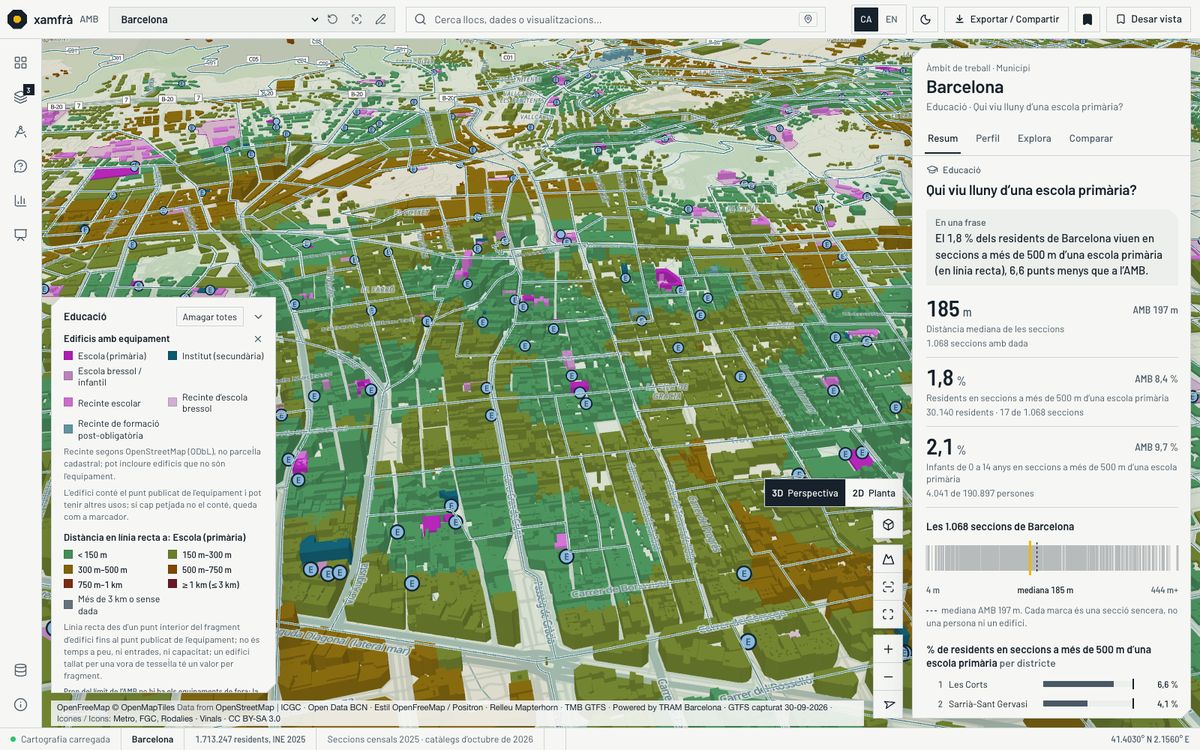
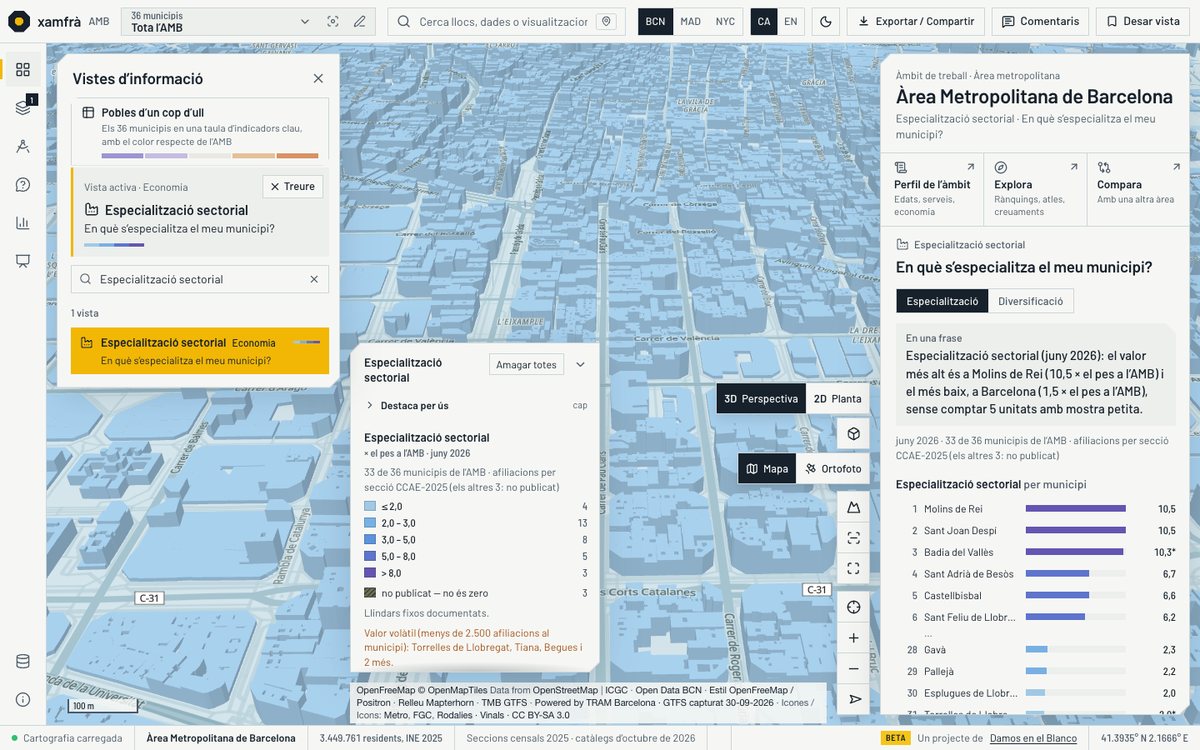
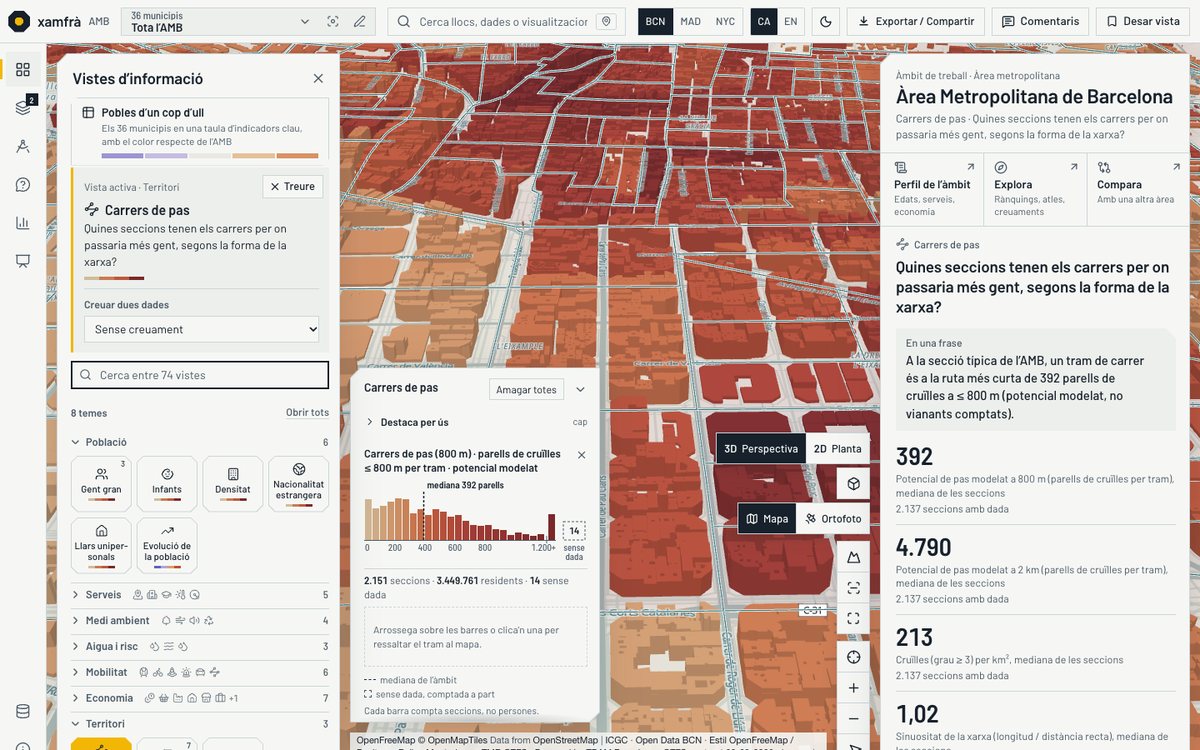
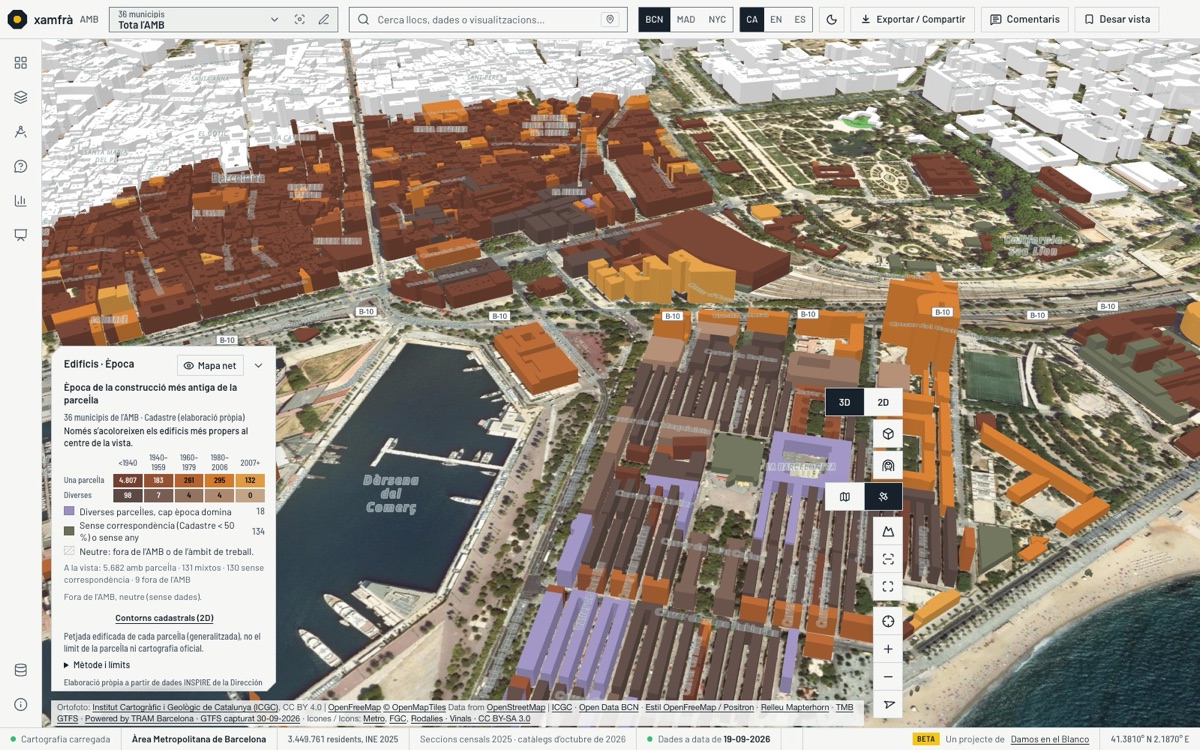
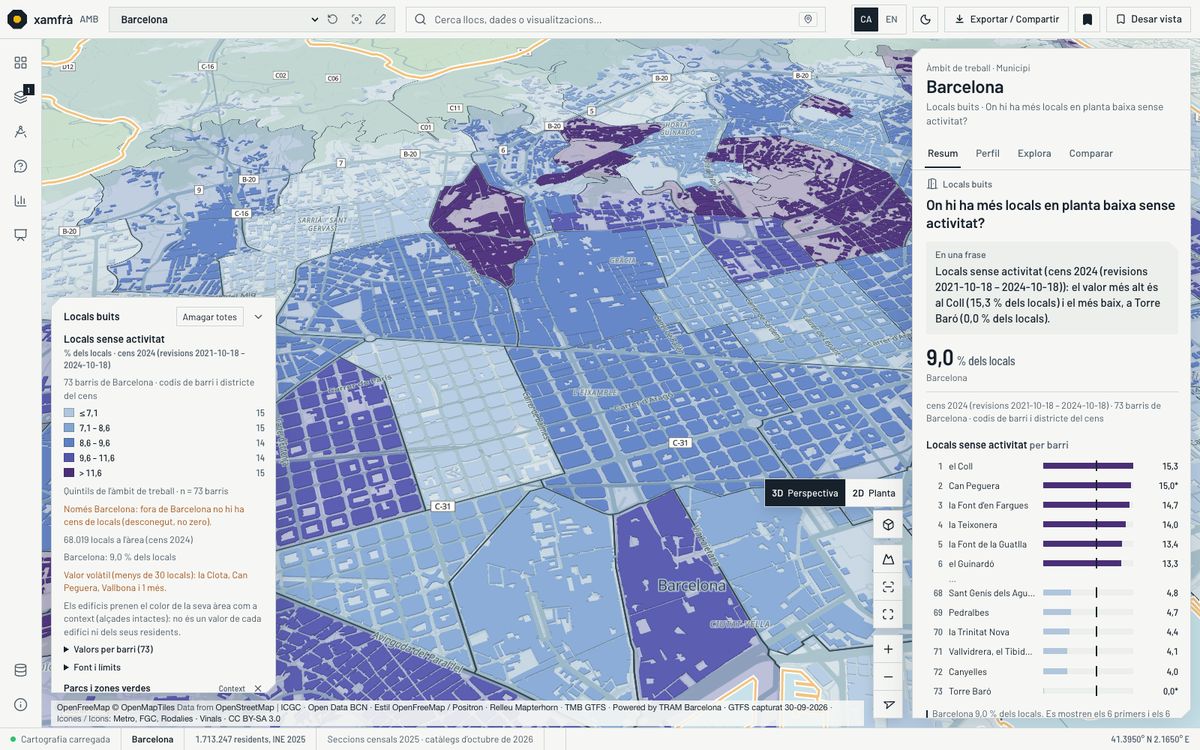
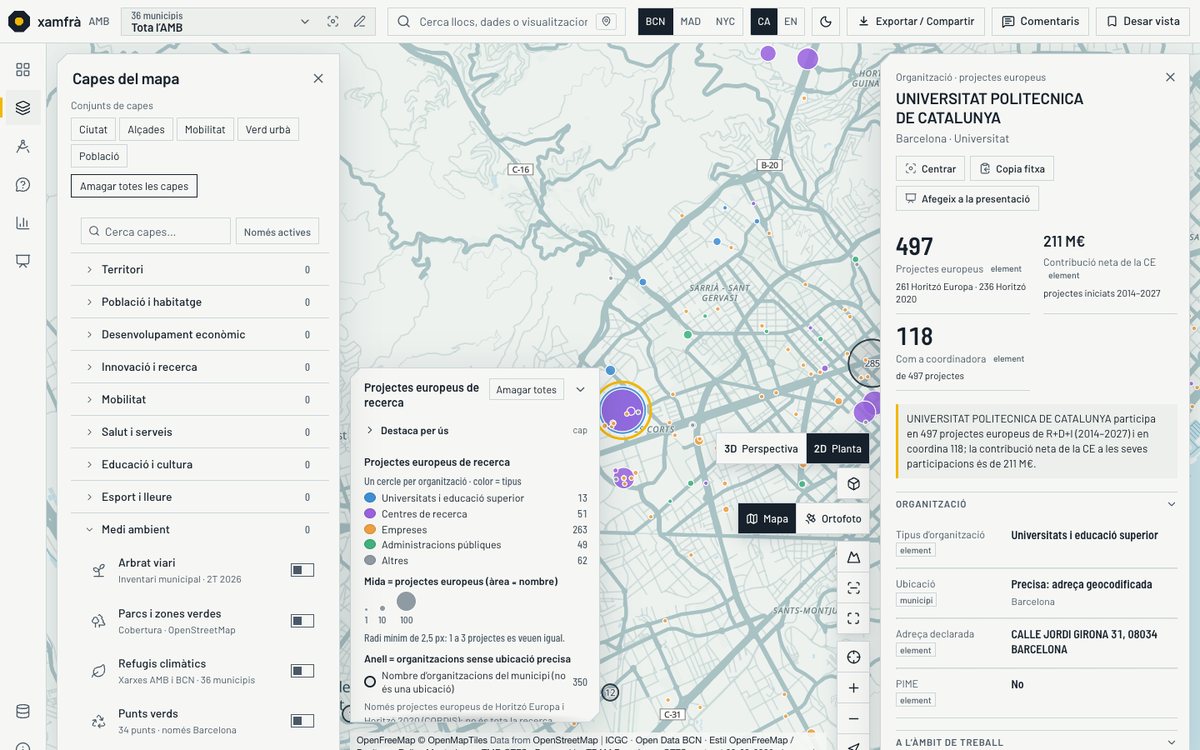
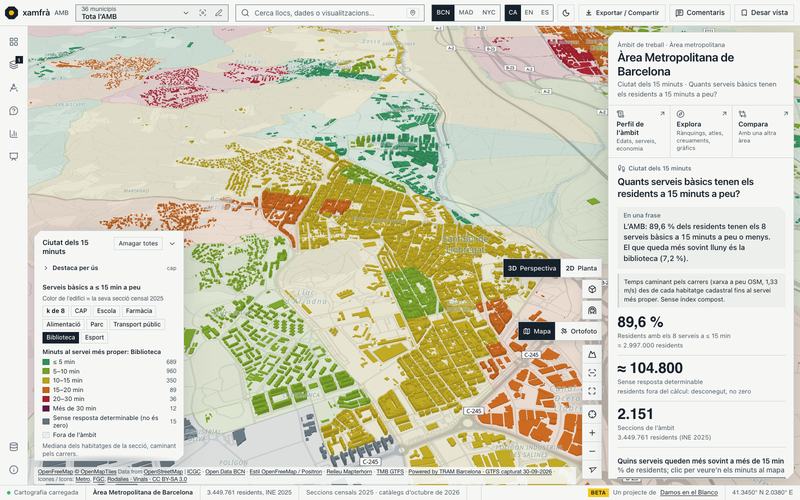
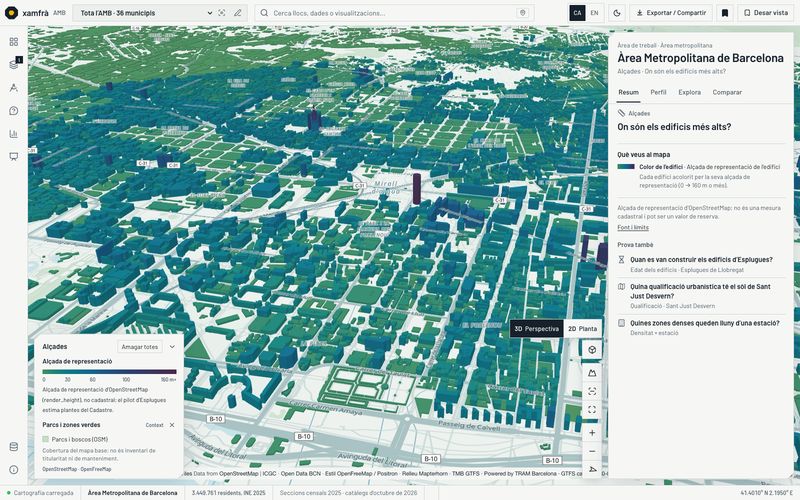
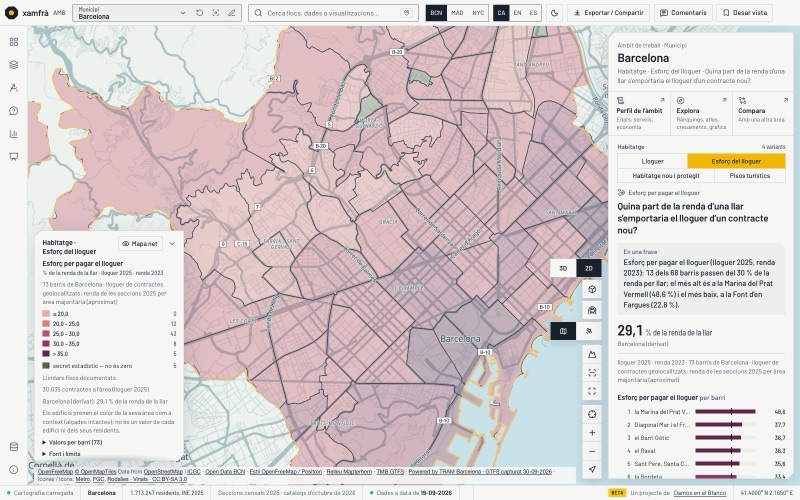
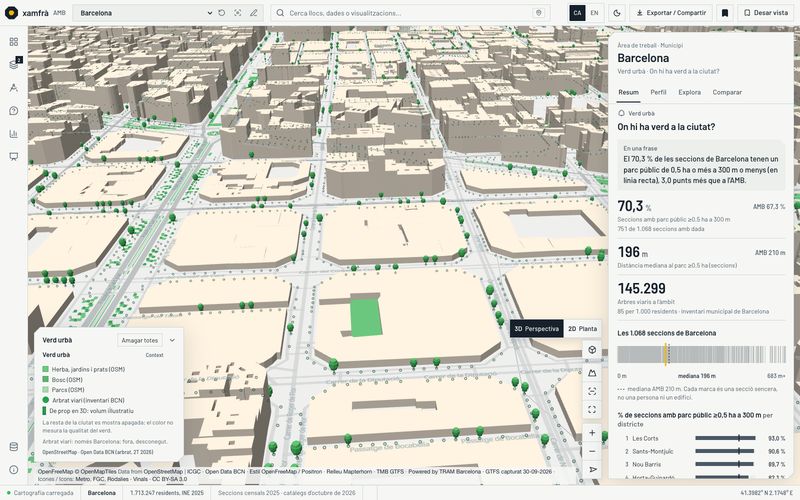
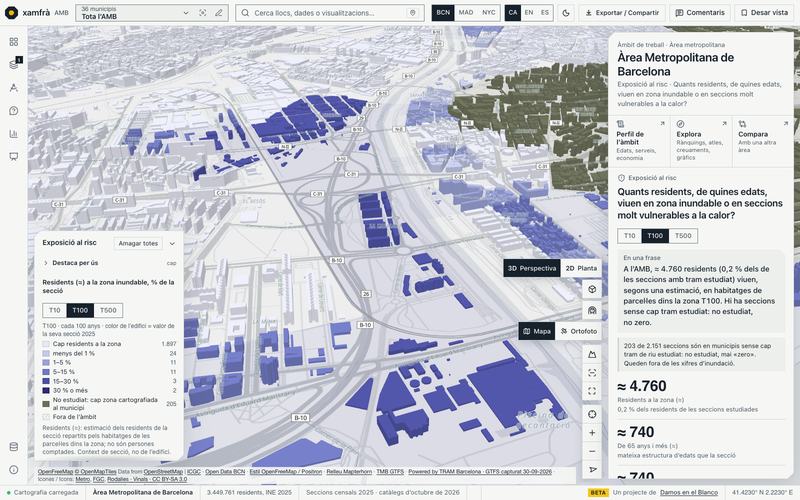
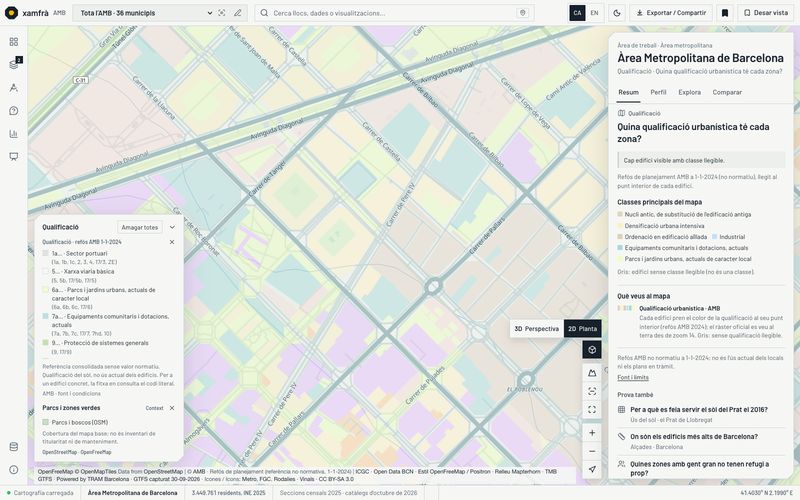
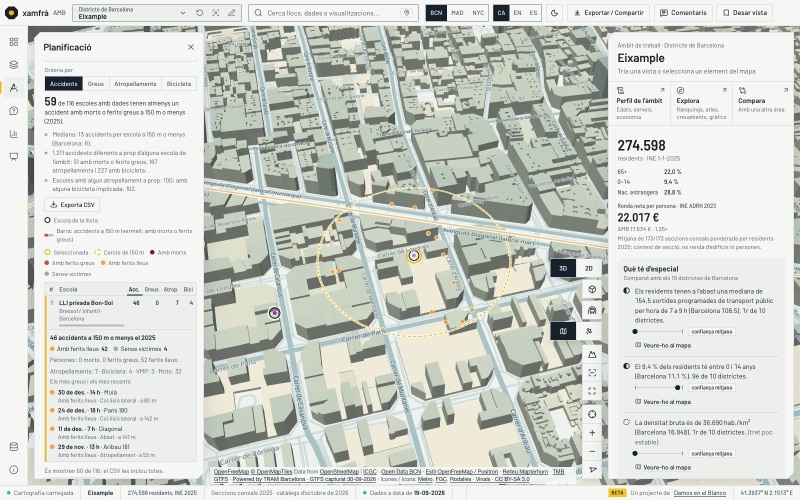
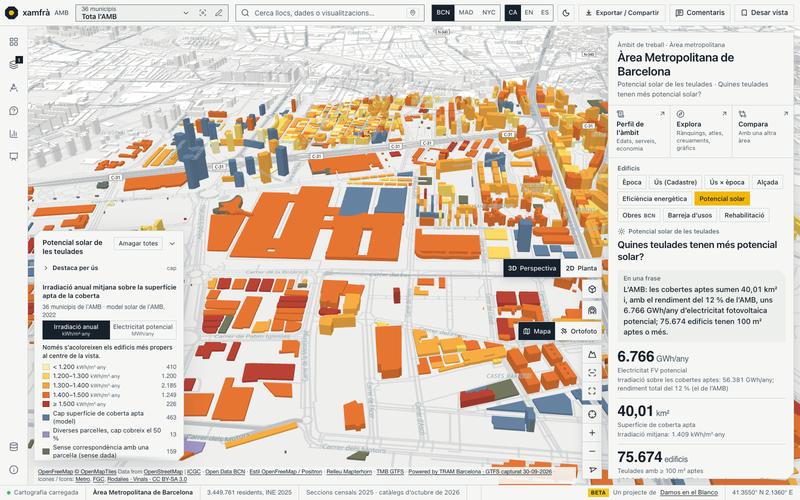
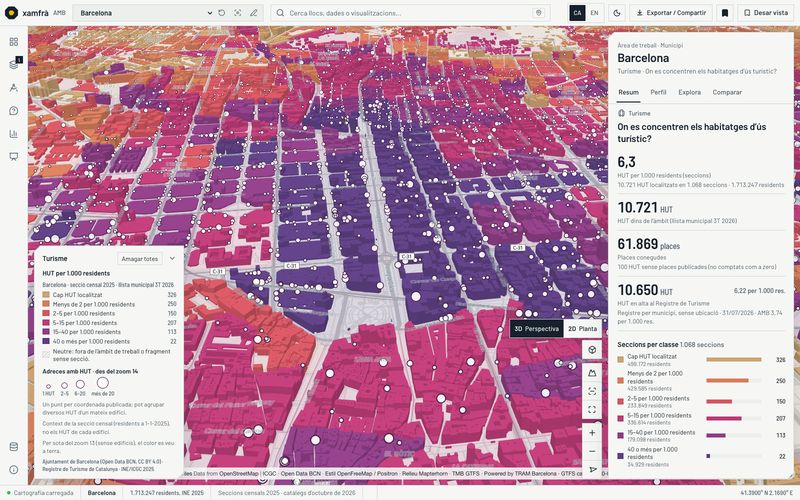
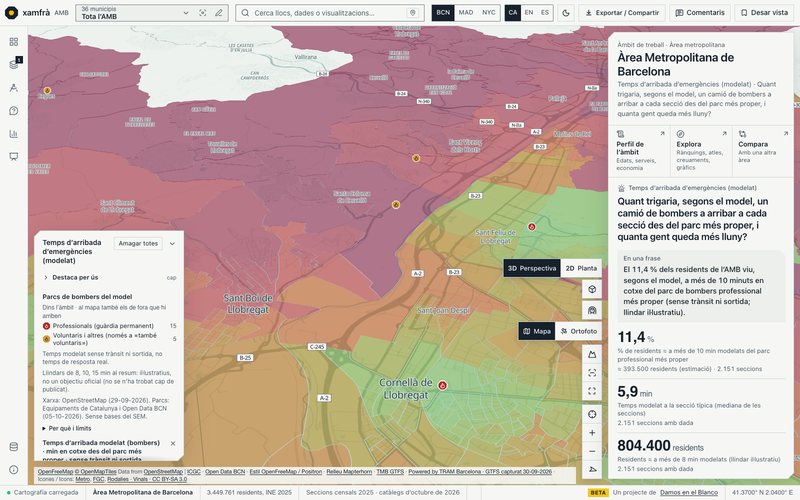
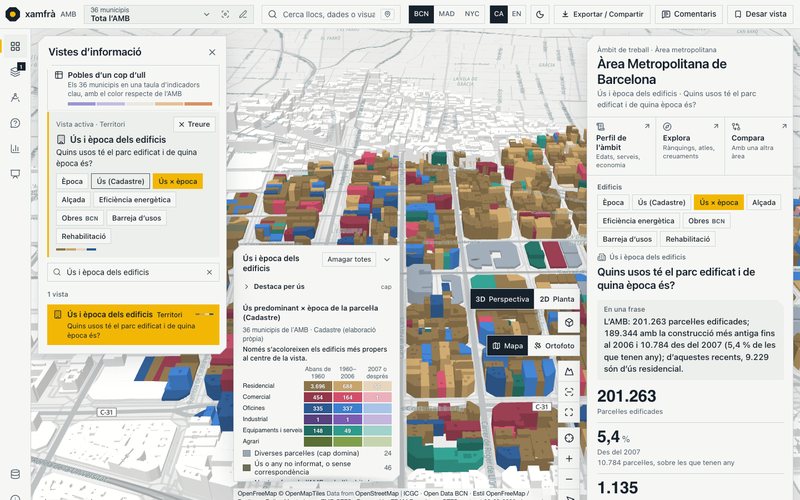
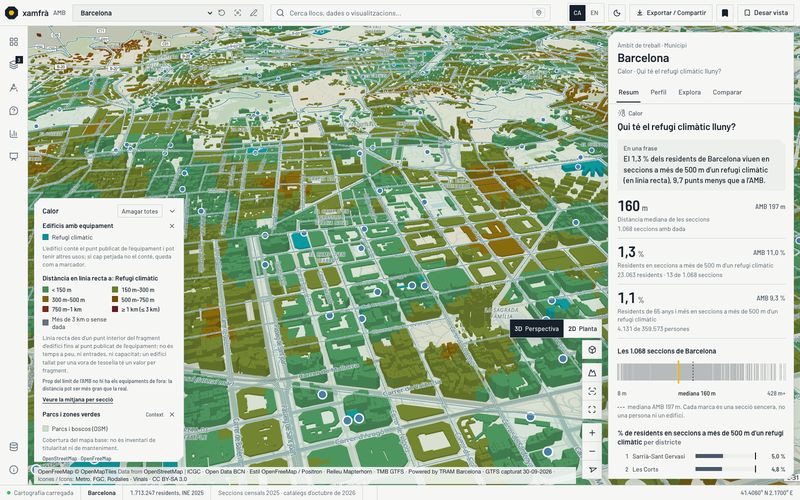
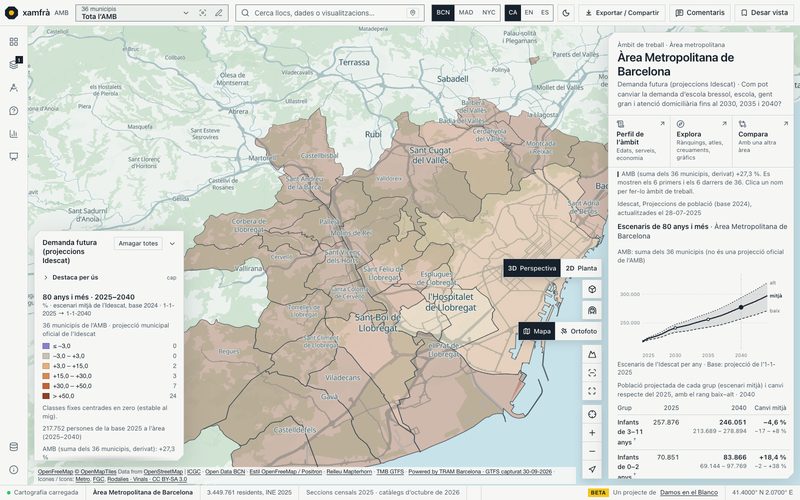
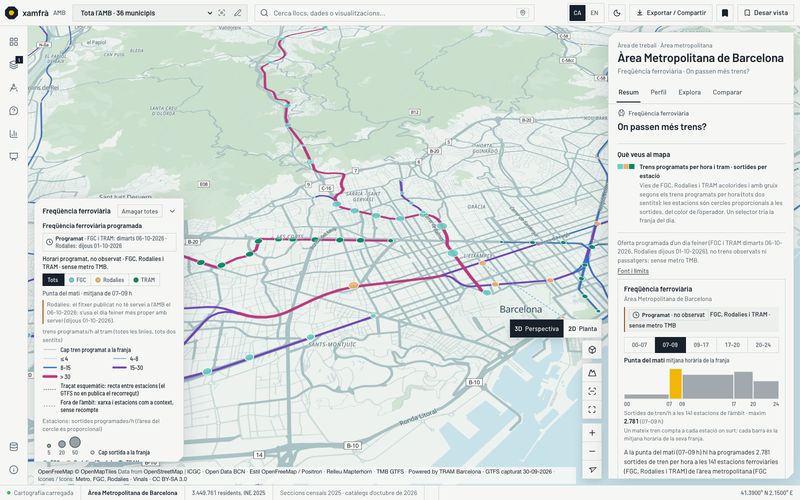
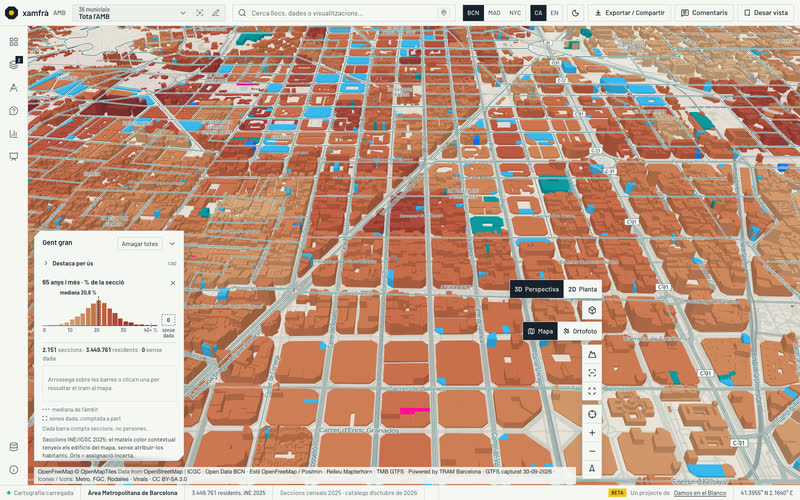
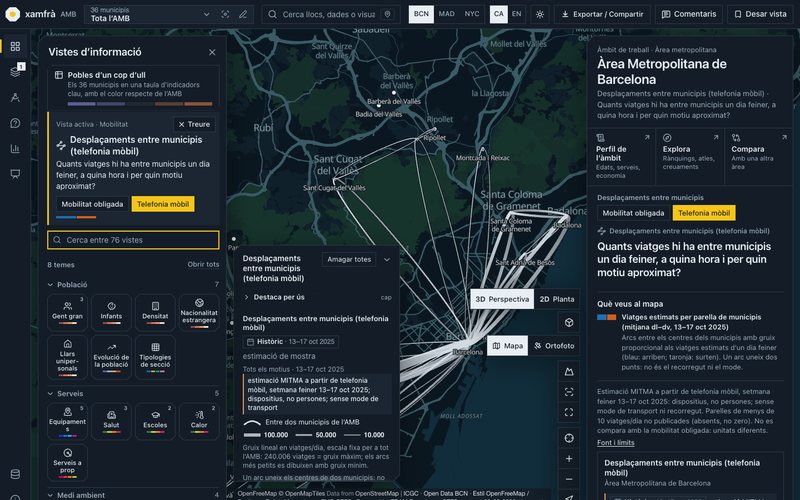
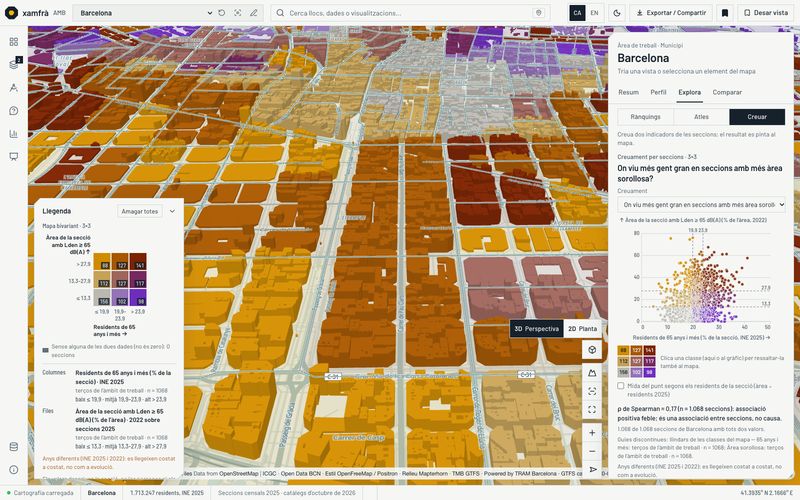
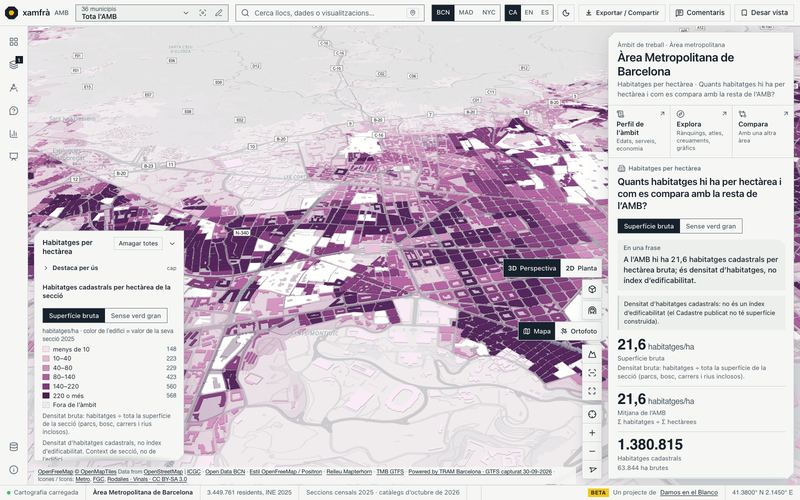
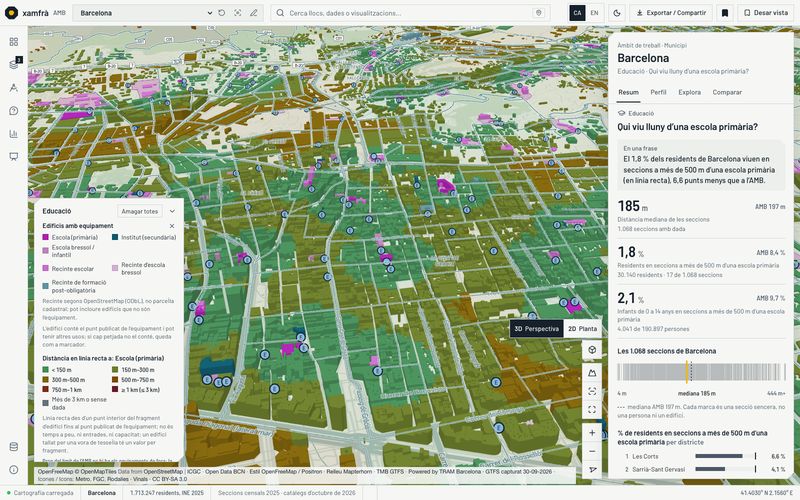
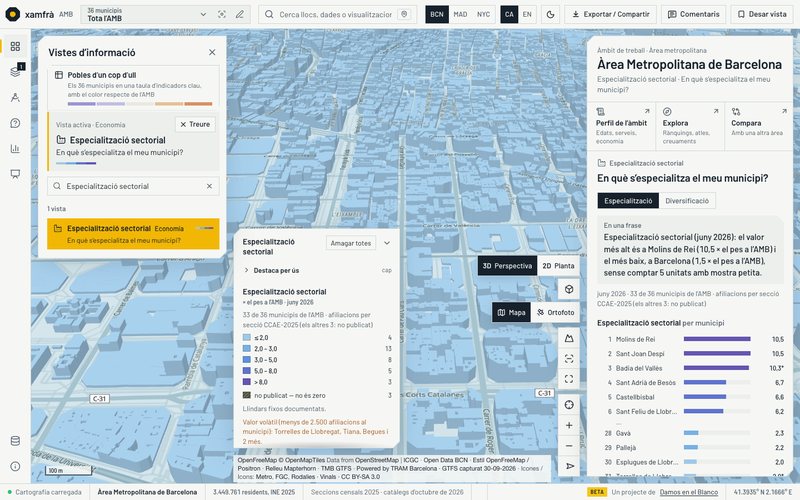
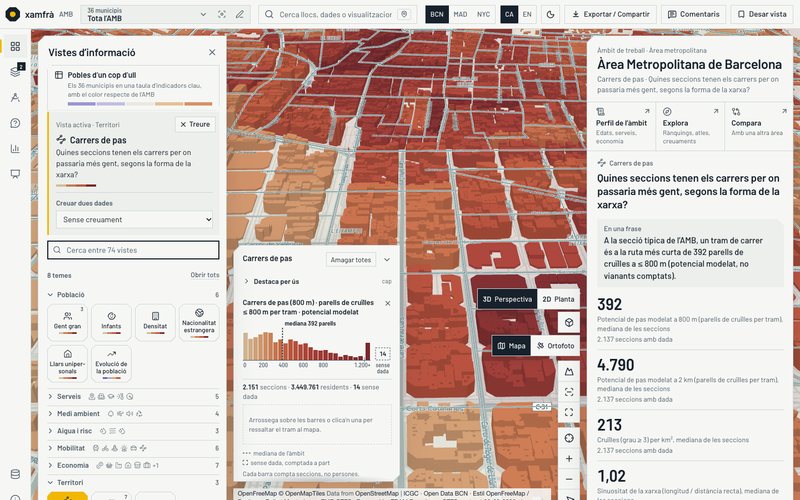
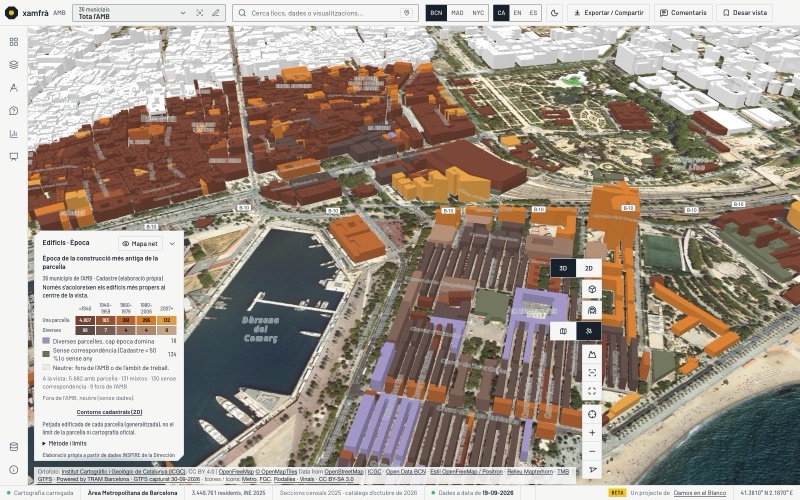
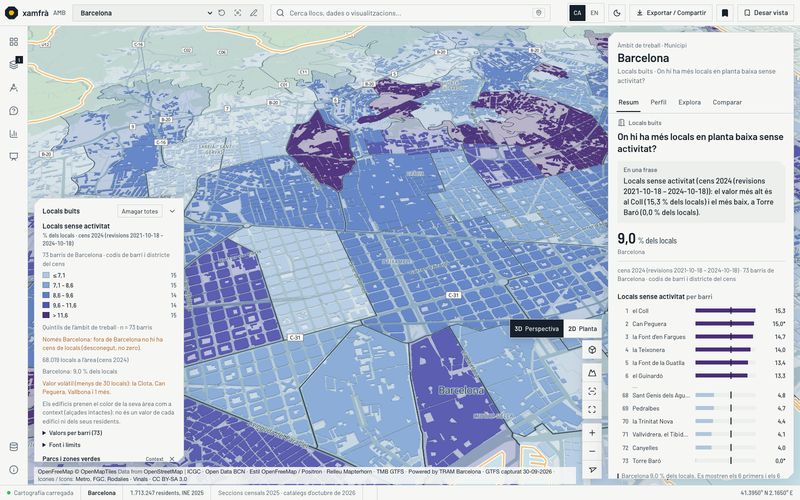
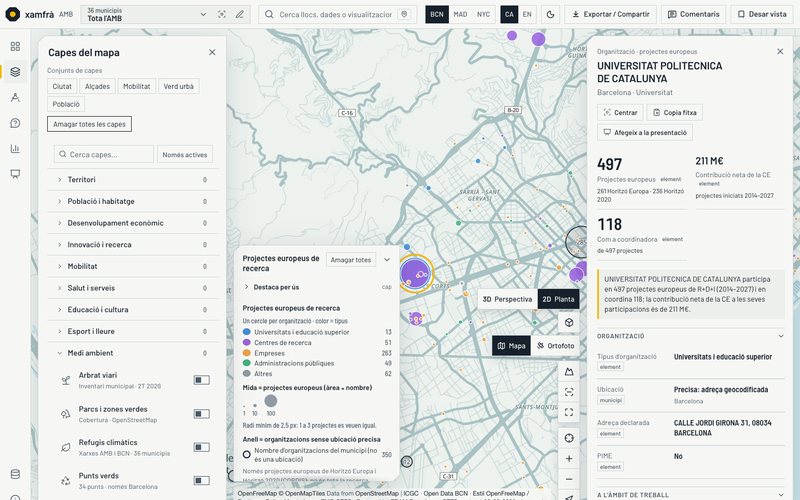
Read, measure, test
Three ways of working on the same work area: the municipality, the district or the polygon you draw. Moving the map does not change the question.
1Read192 views
Pick a question and drag across the legend: the sections in that range light up, with the figure shown next to the one for the whole AMB.
2Measurebuilding, street, stop
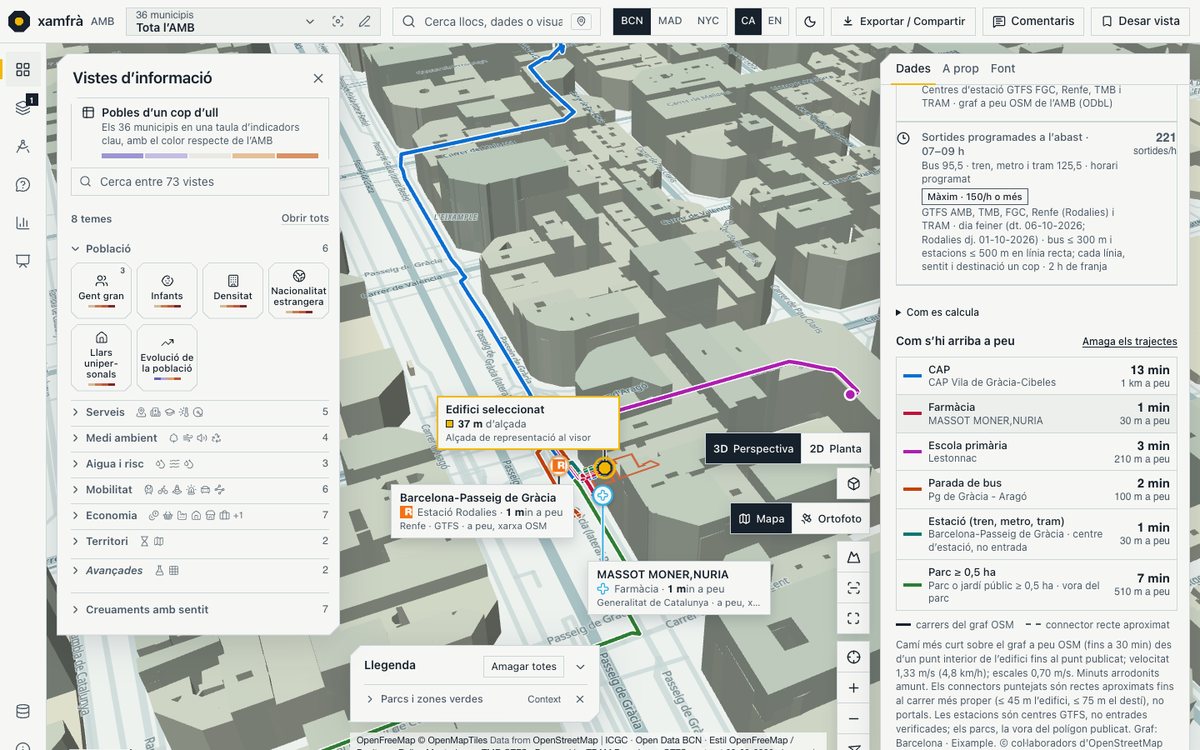
Hover over a building and it tells you what it is; click it for the address, the walking distance and the facilities next door.
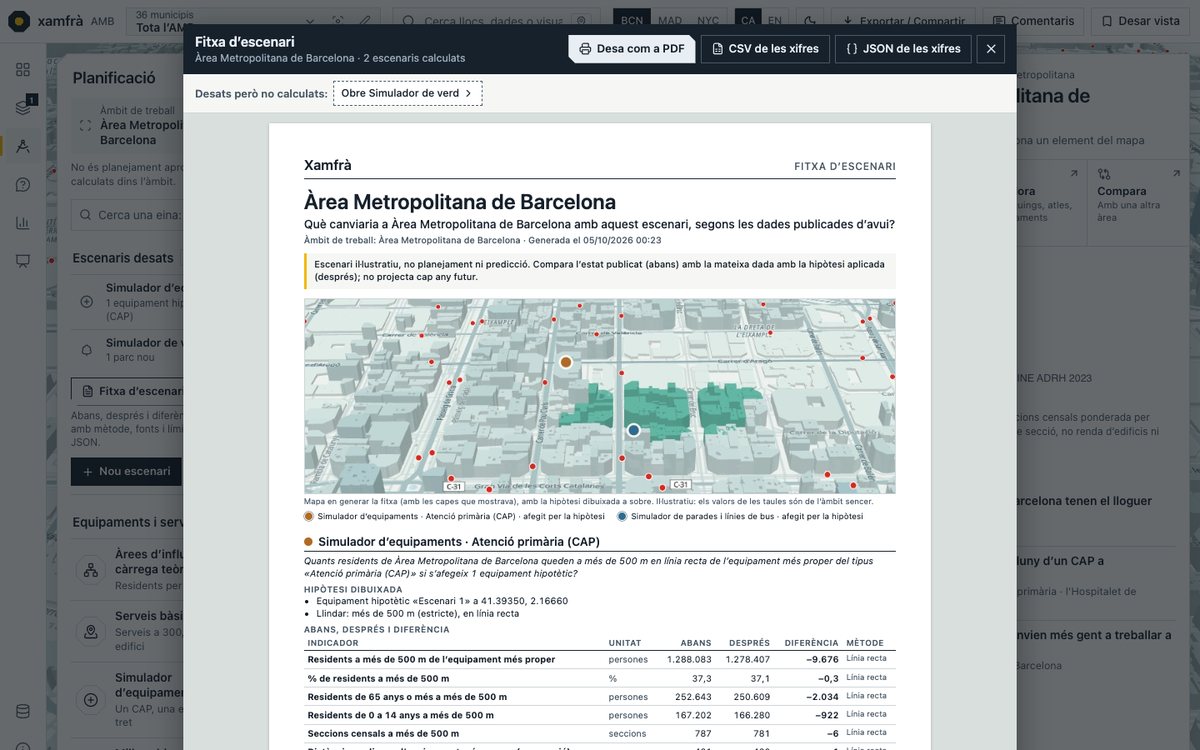
3Test33 tools across the AMB
Try a new facility, a superblock or a new volume. The scenario card compares before and after and exports as PDF, CSV or JSON.
If you do not know where to start, ask the assistant (beta, for registered users): it opens the view, paints the indicator on the map and quotes the source of every figure. How it works →
New (13-10-2026): 109 questions in one drawer, eight own-method detectors counted and never weighted, the validation published, downloadable tables and reports, and 274 datasets with their licence. Order and cross-referencing → The 11-10 detectors →
In motion
Loops recorded in the viewer with the new 3D engine on 11 October 2026, untouched. Each one says whether it shows an observation, a measure, a scenario or the interface.
One camera flight with the new 3D engine: from the 36 municipalities to the Eixample, with density by section and the section card open.
Hover over Hospital Clínic and the viewer says what it is; a click on the building next door opens its card with the facilities within 500 m.
Ctrl+K and “pharmacy”: search finds facilities by type and opens the view with its legend.
Building shadows on Plaça del Sol on 21 June, from 8:30 to 19:30. An indicative study, not a regulatory one.
How it works, in diagrams
Nine ideas from the viewer, drawn rather than captured. They are illustrations without data: the real figures are in the captures and in the viewer.
Measure · published data, with sourceScenario · illustrative assumption
Walking accessibility
Genuinely on foot, not in a straight line
From each doorway, along the streets that can actually be walked, with gradients and a reduced-mobility profile. 15-minute city, “What is within X minutes on foot” and the routes for each building use the same network. Nothing is painted outside the validated network.
For every team, a specific job
Each route starts from a real question, passes through the viewer’s views and tools and ends in a document to take to the meeting.
Urban planning
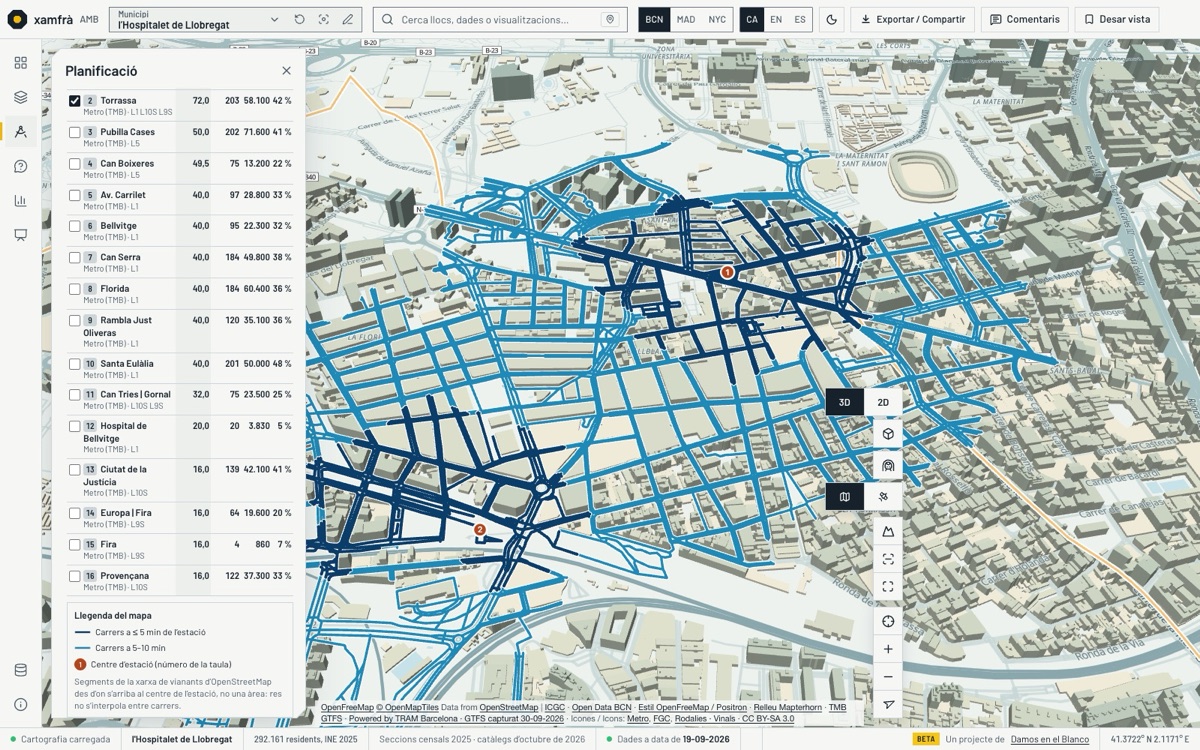
What happens if we densify near the station?
- ReadDwellings per hectare, building use and age across the work area.
- MeasureThe real walking catchment of each station, not a circle.
- TestDensification near transit, massing proposal and shadows.
- Densification near transit
- Massing proposal
- Shadows and hours of sun
The massing proposal is an illustrative scenario, not approved planning.
Mobility
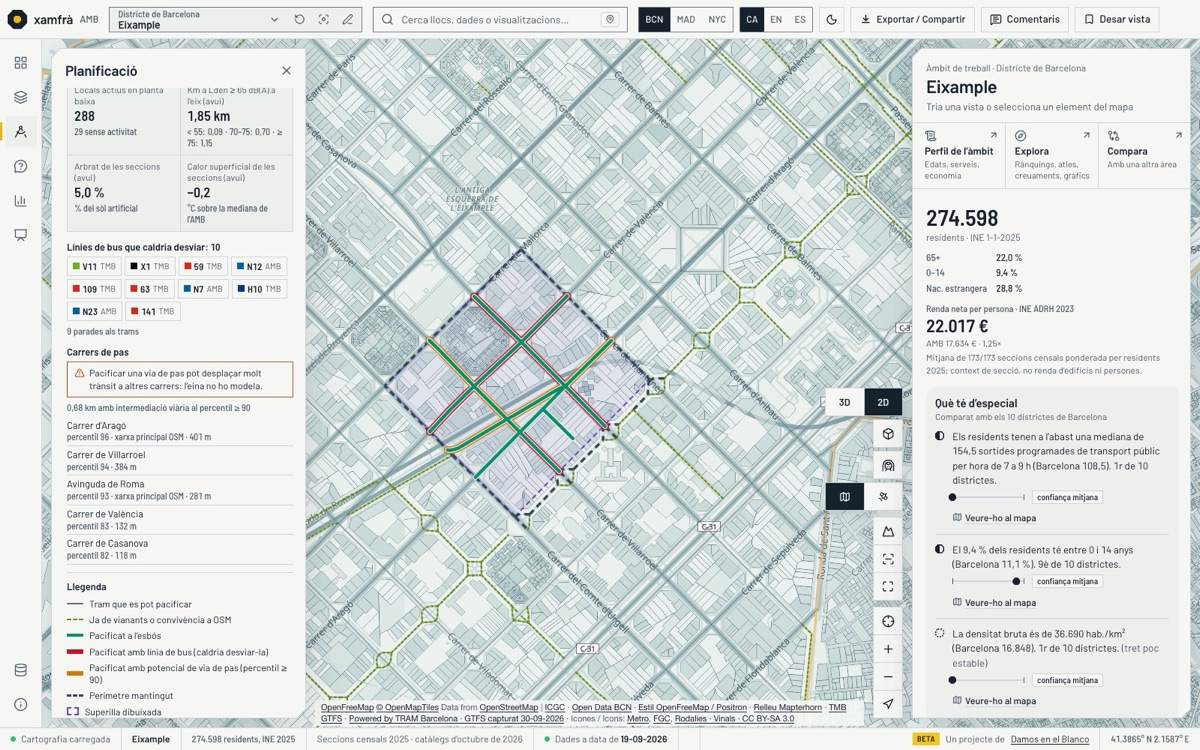
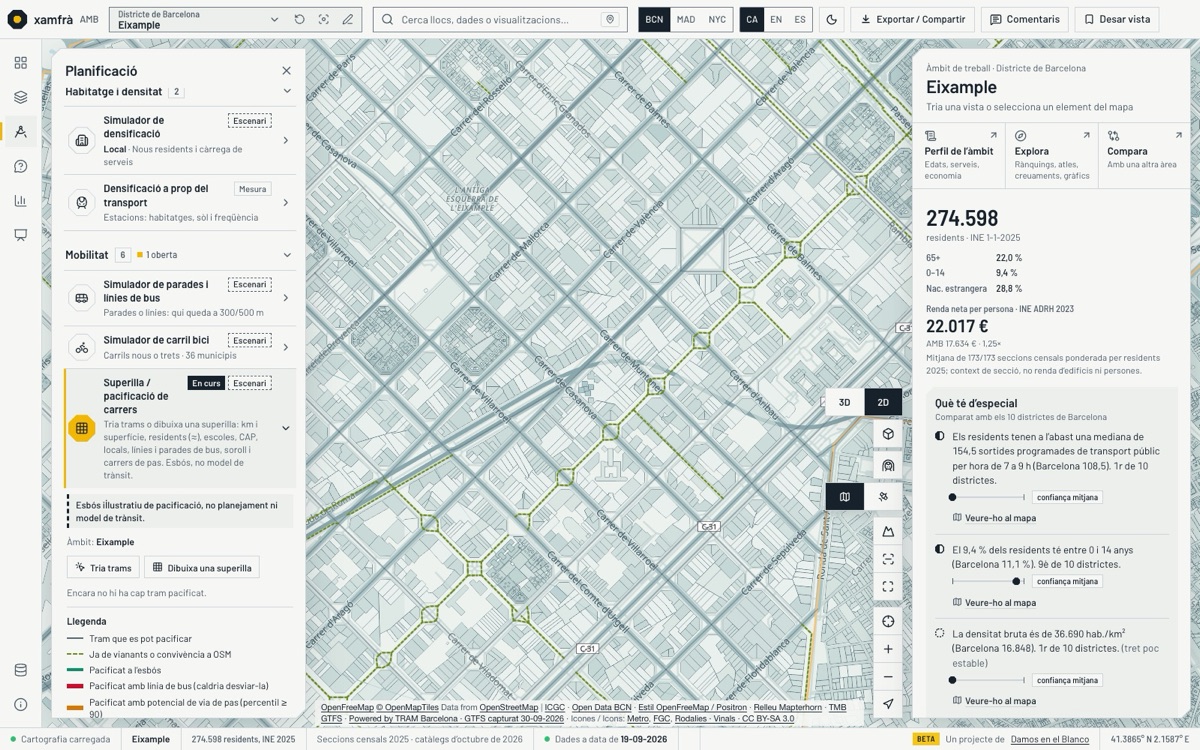
Where does a superblock or a new cycle lane make sense?
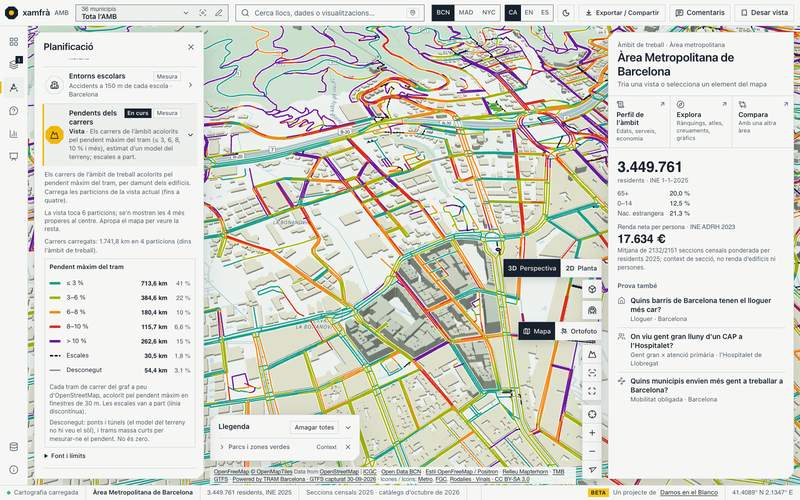
- ReadBus frequency by segment, through streets and gradients.
- MeasureThe street section, façade to façade (beta in Barcelona).
- TestSuperblock and cycle lane, with the noise and bus lines of the segment.
- Superblock / street pacification
- Cycle lane simulator
- Street grades
Lanes estimated from OpenStreetMap are marked ≈; the superblock does not model traffic afterwards.
Health and services
Who lives far from a CAP, and where would a new one fit?
- Read37.3% of AMB residents live in sections more than 500 m from a CAP.
- MeasureThe walking distance from each building and the “How to get there” route.
- TestBest location and facility simulator.
- Best location
- Facility simulator
- Catchments
In the overview it is straight-line distance; the walking distance is on the building card.
Education
Which school surroundings should be pacified first?
- Read159 of Barcelona’s 754 schools have serious accidents nearby (GUB 2025).
- MeasureNoise, traffic and gradients around each school.
- TestSchool surroundings and pacification of the segment.
- School surroundings
- Noise-sensitive receptors
- Superblock / street pacification
It shows a concentration of accidents, not a risk index.
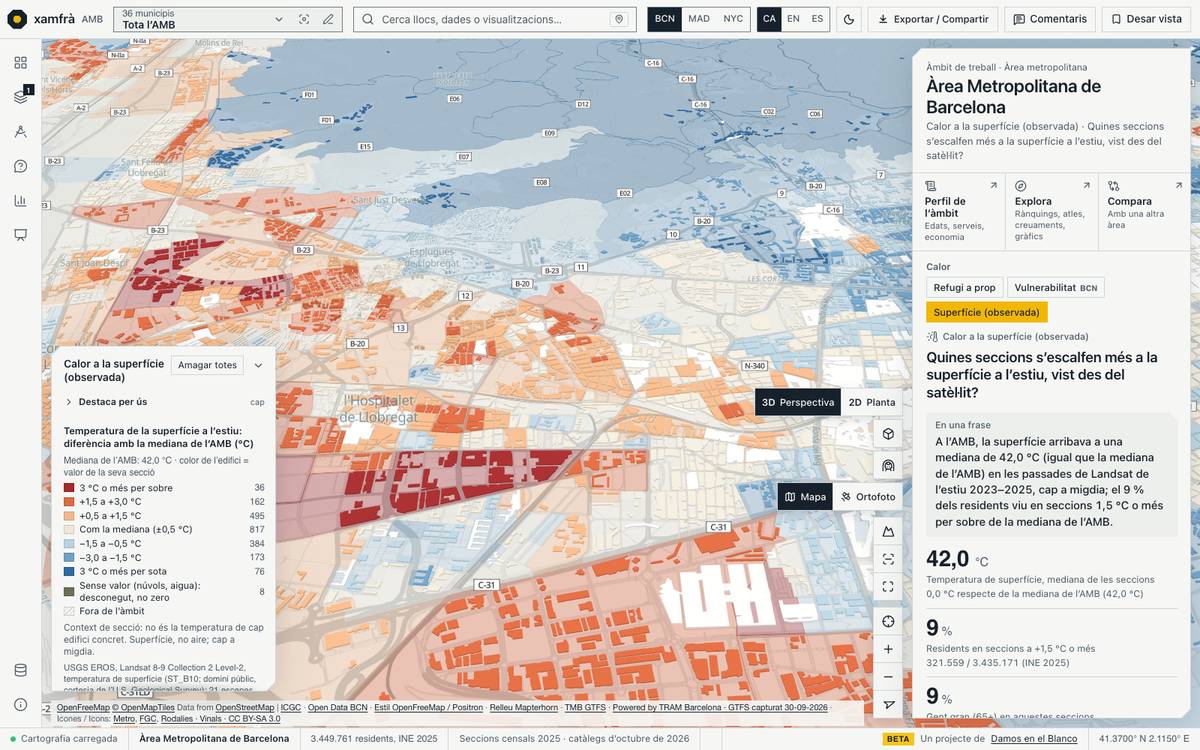
Climate and green
Where is it hottest and where is shade missing?
- ReadObserved surface heat and climate shelters: 11.0% of residents live far from them.
- MeasureShade on squares, hour by hour.
- TestGreen space simulator with new trees.
- Shade on squares
- Green space simulator
- Shadows and hours of sun
Surface temperature, not air temperature.
Civil protection
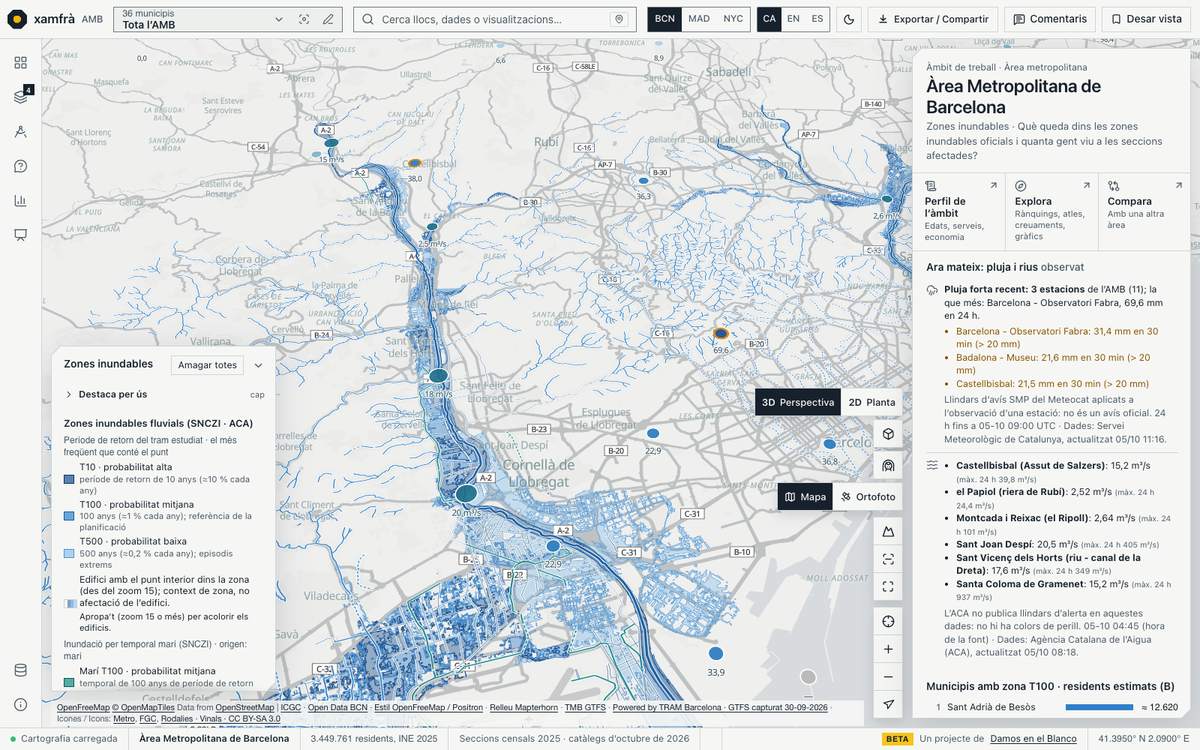
What is happening now with rain and rivers?
- ReadObserved rain from Meteocat and ACA river gauges, “Water now”.
- MeasureResidents and facilities in the T10, T100 and T500 flood zones.
- TestFire service reach by driving time (modelled).
- Risk exposure
- Emergency reach
- Water now
An observation with the time of each station; not a forecast.
Housing and economy
Where does rent weigh most on income?
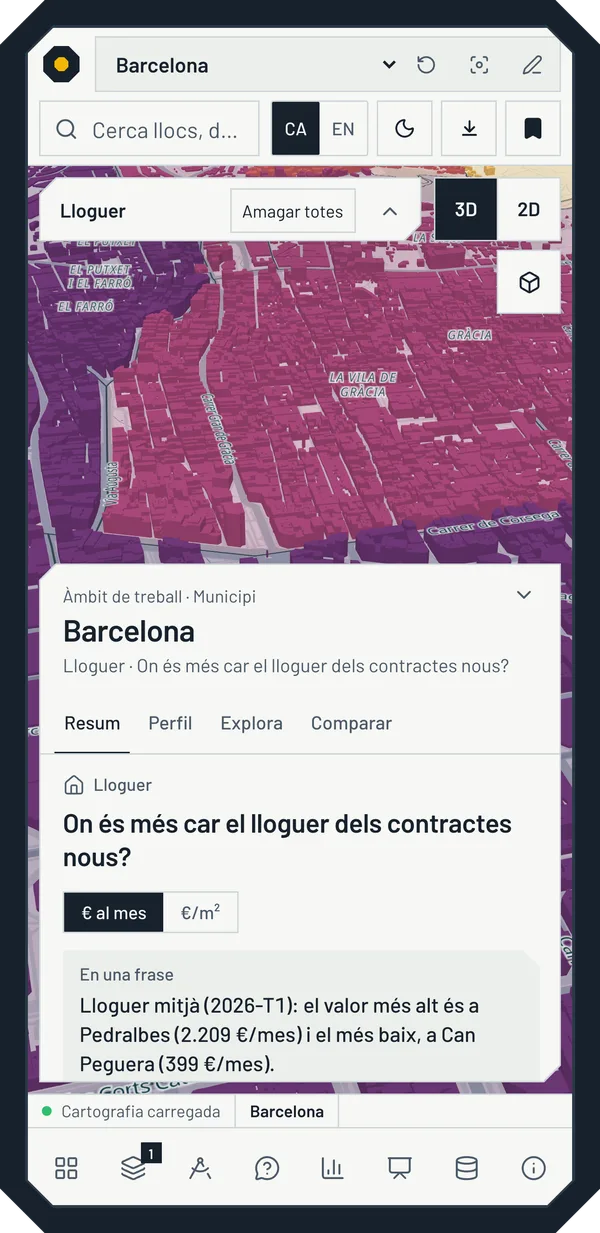
- ReadRent for new contracts: €1,071 a month on average across the AMB (Incasòl, 2026 Q1).
- MeasureRent burden on income and its evolution since 2016.
- TestFuture demand using Idescat projections.
- Densification simulator
- Future demand
- Tourist-use dwellings
A neighbourhood or section value, never the price of a building.
Operators and infrastructure
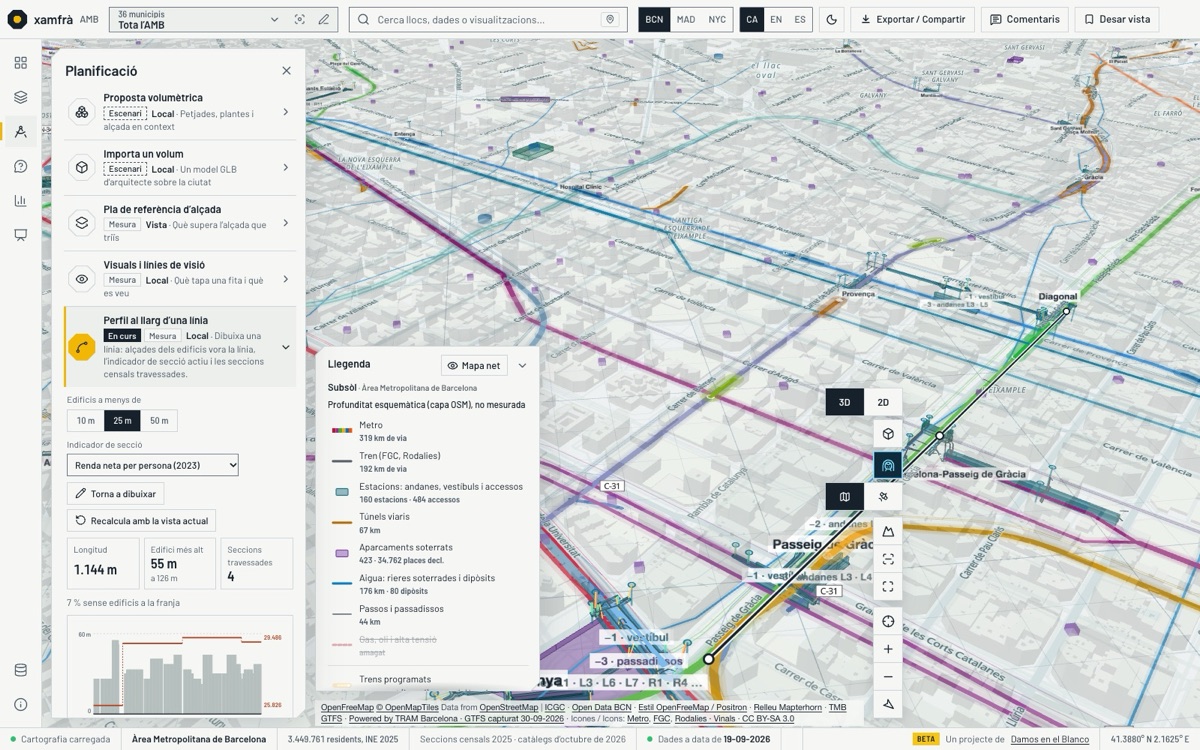
What is under the street where we will open a trench?
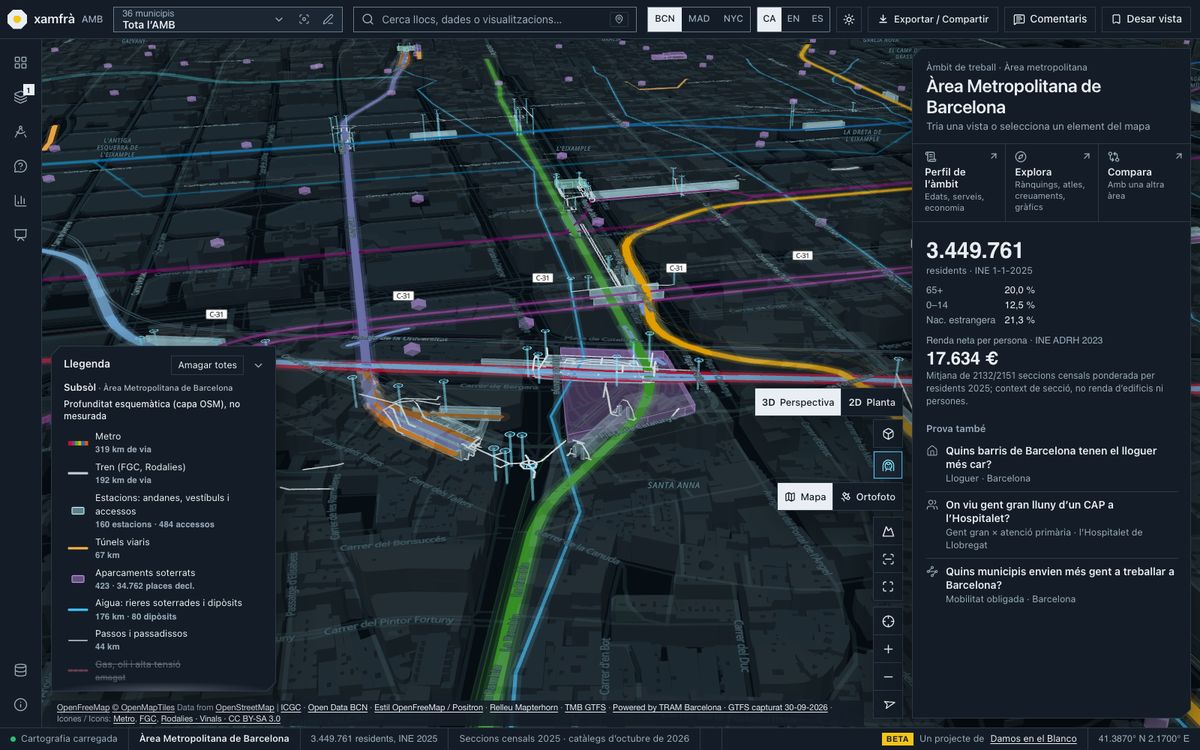
- ReadSubsurface: metro, tunnels, car parks and stormwater tanks.
- MeasureProfile along a line and views.
- TestImport your own volume as glTF or GeoJSON, or a layer of your own.
- Profile along a line
- Import a volume
- Views and lines of sight
Public networks from OpenStreetMap; the operator’s own go in as a layer of their own.
Planning drawer
33 tools, each with its own label
Facilities and services
- Catchments and theoretical load (measure)
- Basic services nearby (measure)
- What is within X minutes on foot (measure)
- Facility simulator (scenario)
- Best location for a new facility (scenario)
- Equipment land without catalogued facilities (measure)
- Noise-sensitive receptors (measure)
Housing and density
- Densification simulator (scenario)
- Densification near transit (measure)
- Metropolitan scenario simulator (scenario)
Mobility
- Bus stop and line simulator (scenario)
- Cycle lane simulator (scenario)
- Superblock / street pacification (scenario)
- Bus stop spacing (measure)
- Planned network (context) (measure)
- What would this line bring? (scenario)
- Growth and service (measure)
- Frequent network (measure)
- Interchange quality (measure)
- Business parks and public transport (measure)
- Public transport report (measure)
- Public transport travel time (measure)
- School surroundings (measure)
- Street grades (measure)
Green, climate and surroundings
- Green space simulator (scenario)
- Shadows and hours of sun (scenario)
- Shade on squares (measure)
Massing and views
- Massing proposal (scenario)
- Import a volume (scenario)
- Height reference plane (measure)
- Views and lines of sight (measure)
- Profile along a line (measure)
General tools
- Sketch, measure and notes (measure)
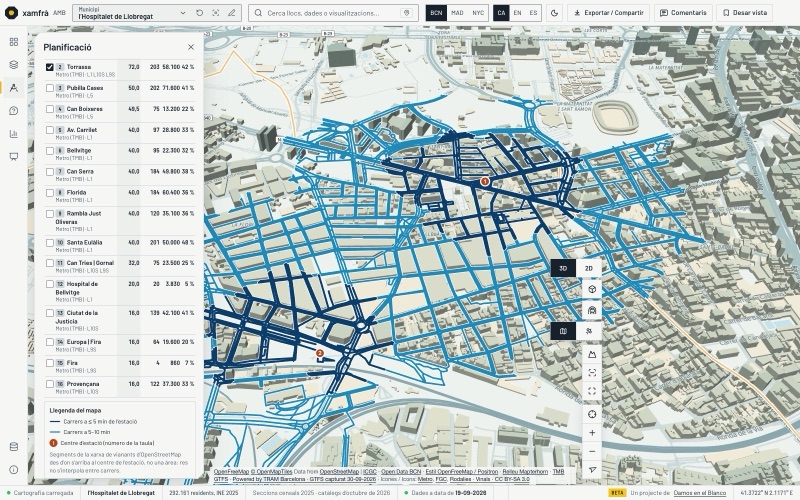
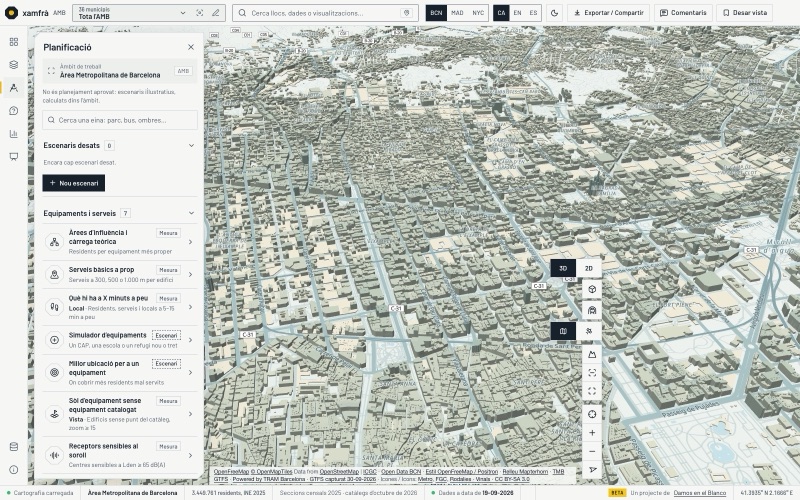
20 studies, each with a method of its own
Beyond the views: long questions about economy, planning, housing, mobility and climate, answered with official data, a named method and the literature that frames it. We publish their abstracts as a scientific journal would.
Own method: count, don’t weight
In the Cerdà Plan (1859), the corners of the Eixample blocks are cut into a chamfer —a xamfrà— so that from the crossing you can see further. We do the same with data: we cut the corner where arbitrary weights and invented values hide, so that decision-makers see the criterion, the limit and the source before the number.
- Counted criteriaHow many explicit criteria each place meets, and which. No score that blends different things with hand-picked weights.
- Unknown ≠ no ≠ zeroA gap is called a gap: in figures, tables and text. A zero is a measurement, not an absence.
- Sensitivity is a resultIf changing a threshold or a reference changes the conclusion, we publish that as part of the conclusion.
- Every figure, checkedThe numbers in the abstracts are compared automatically with the data file they come from. Literature frames the question; it never replaces a datum.
Own methods 20
- Sector space and candidate ruleMunicipal RCA → co-specialisation proximity → relatedness density → Fitness–Complexity → counted candidate rule; no composite index.
- Six-ingredient count with visible thresholdsEach place (activity pole, PDU proposal or campus) gets six yes / no / unknown answers with their figure and source; they are counted, never weighted.
- Counted growth–inclusion quadrantChange and rank per indicator, count of indicators better than the median of the 36 municipalities; no weights, no composite index.
- Counted scaling residualsLog–log fit on the Catalan reference municipalities, residual of each AMB municipality relative to its size and a counted rule per indicator, with no composite index.
- Nine counted criteria per estateNine explicit rules per estate, read as healthy / watch / at risk / no data and counted; no global score or weighting.
- Series reading with published windowsA single official source, 12-month windows without unpublished months, hidden cells as intervals and the reform as a date: counted, not attributed.
- Descriptive area–municipality double difference on harmonised sectionsChange in the transformed area minus change in its municipality, on census sections linked across two years; no counterfactual and no significance test.
- Delivery cohorts with a registered baselineWeighted delivery rate of open MUC sectors by approval cohort, cross-checked with the Cadastre, and a published 2026 baseline reviewed every year with a back-test.
- Three reuse lenses with counted rulesFor schools, vacant premises and offices, explicit yes / no / unknown rules on open data; a candidate when every criterion is «yes», unknown is never «no», no weighted index and no owner data.
- Per-transformation static residual with counted legal captureResidual value unit by unit, legal obligations summed, three scenarios and one-at-a-time sensitivity; unknown with a reason.
- Per-thousand-household balance and years to coverRegistered demand, stock in force, completion pace and planning on one scale per municipality; ratios, never forecasts; unknown with a reason.
- Counted rent–commute quadrantsSelf-containment, flow-weighted commute, jobs/workers and rent per municipality → change 2021→E → quadrant by an explicit rule against the median; flows as a safe minimum. No composite index.
- Neighbourhood lag panelCross-correlations of yearly changes (lags −3…+3) with a cluster bootstrap over neighbourhoods, and an ordered-rule typology on city quantiles
- Directed-modularity basins with a robustness auditDirected Louvain (γ = 1) on the MITMA trip network of the 36 municipalities, checked against shuffled labels, noise, a resolution sweep and the INE census 2021–2024.
- Line × month panel with network–line–station decompositionStation and line × month fixed effects on ln(riders), exposure to newly licensed housing within 800 m lagged 12 months, a placebo and a three-layer decomposition of annual growth.
- Pair-by-pair PT / car competitiveness test with corridorsScheduled timetable (RAPTOR) against a declared reference car; a three-criterion counted rule per zone pair; pairs added into corridors between municipalities.
- Drainage criteria count by catchment proxyFive explicit criteria counted as met, not met or unknown per proxy drainage unit; no weighted index and no hydraulic model.
- Scenarios, yardstick and garage ruleThree counted readings, no index: arithmetic plug-in scenarios → AFIR-yardstick coverage with today’s network → quadrant; three Cadastre criteria of likely garage + 400 m → section class; roofs ÷ 2030 demand.
- Band-by-band exposure of the wildland-urban interfaceDwellings, ≈ residents, ages, building age and modelled arrival time per band of 0–25 and >25–100 m from forest; separate figures, never an index; unknowns apart.
- Three-valued count of explicit criteriaEvery criterion is yes / no / unknown with a visible threshold; criteria are counted per family, never weighted or subtracted; the unknown is reported; every dataset carries a manifest, sensitivity and a back-test.
Street sections · beta in Barcelona
Click a street and get its section
Façade to façade, with the pavements and carriageway measured from the municipal 1:1000 mapping. In the workshop you redistribute it, compare it with the original and export it.
- Widths are calculated, never assumed.
- Lanes not recorded in the mapping are estimated from OpenStreetMap and marked ≈.
- Export as SVG or as Streetmix-compatible JSON.
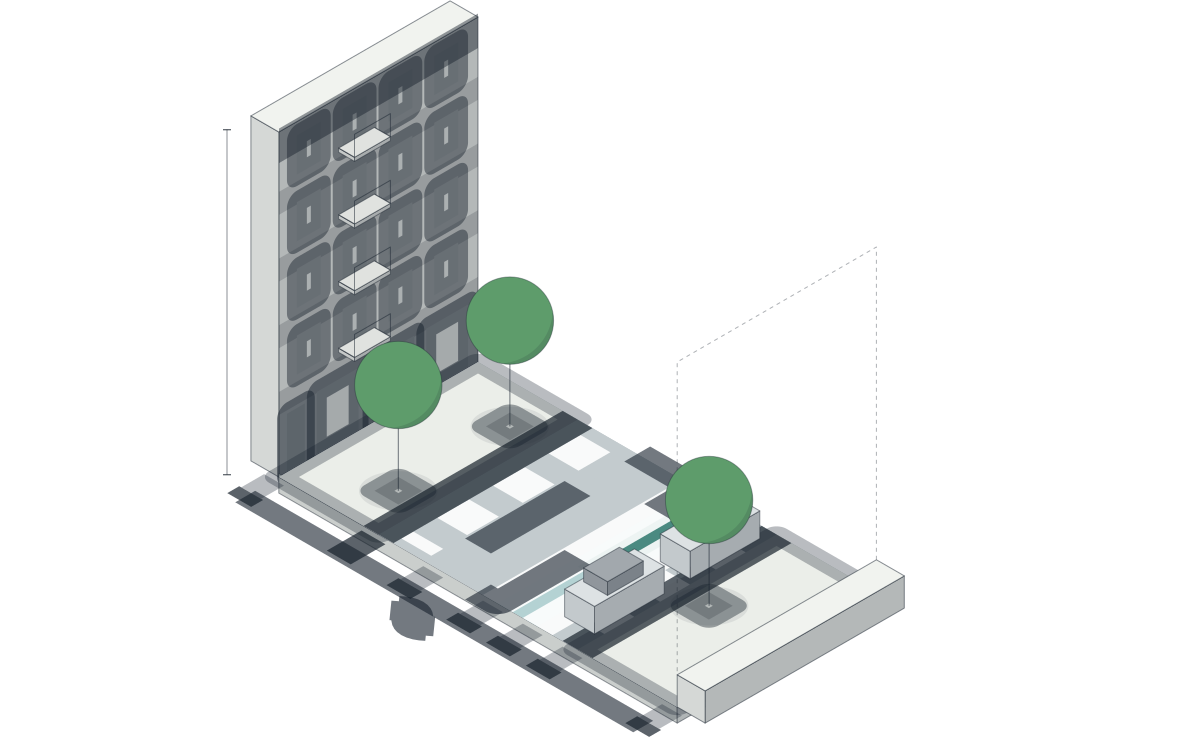
Real viewer data for Passeig de Sant Joan: pavements and green strip measured on the municipal 1:1000 map; car lanes estimated (≈). The proposal is an illustrative scenario, without widths.
Below, above and right now
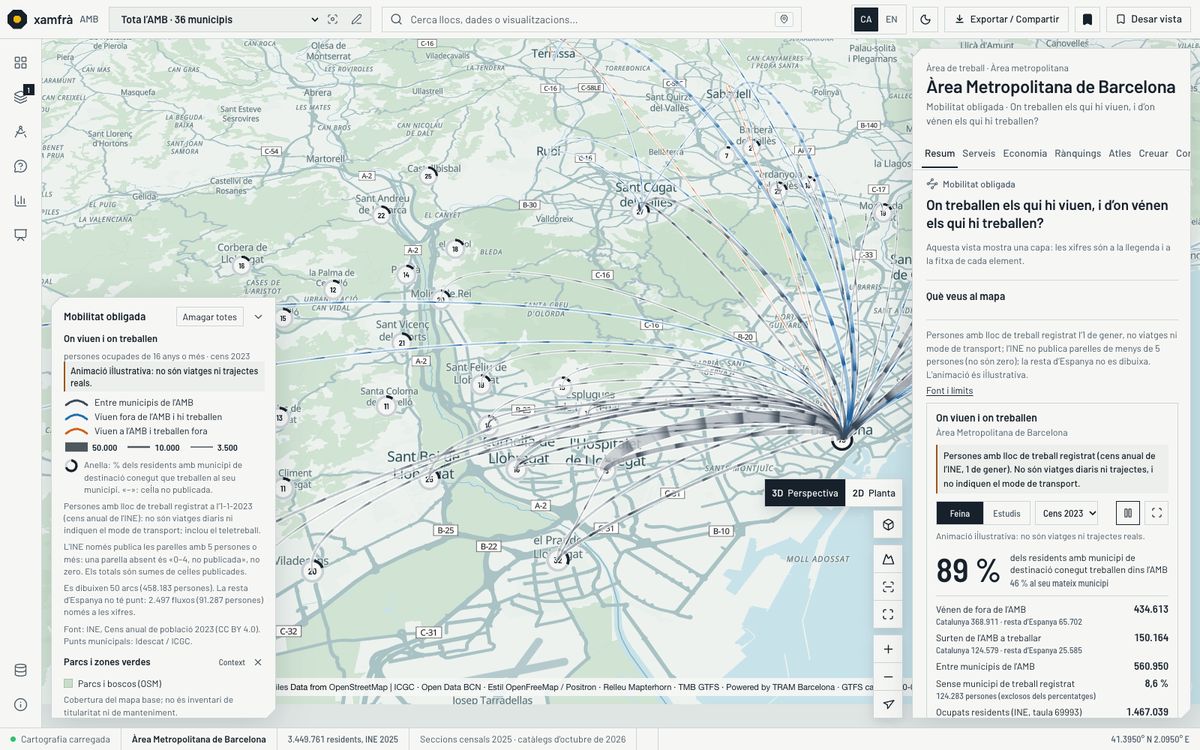
What you cannot see from the street: tunnels and tanks, rooftop heat, today’s rain and rivers. Observed, scheduled and illustrative are always told apart.
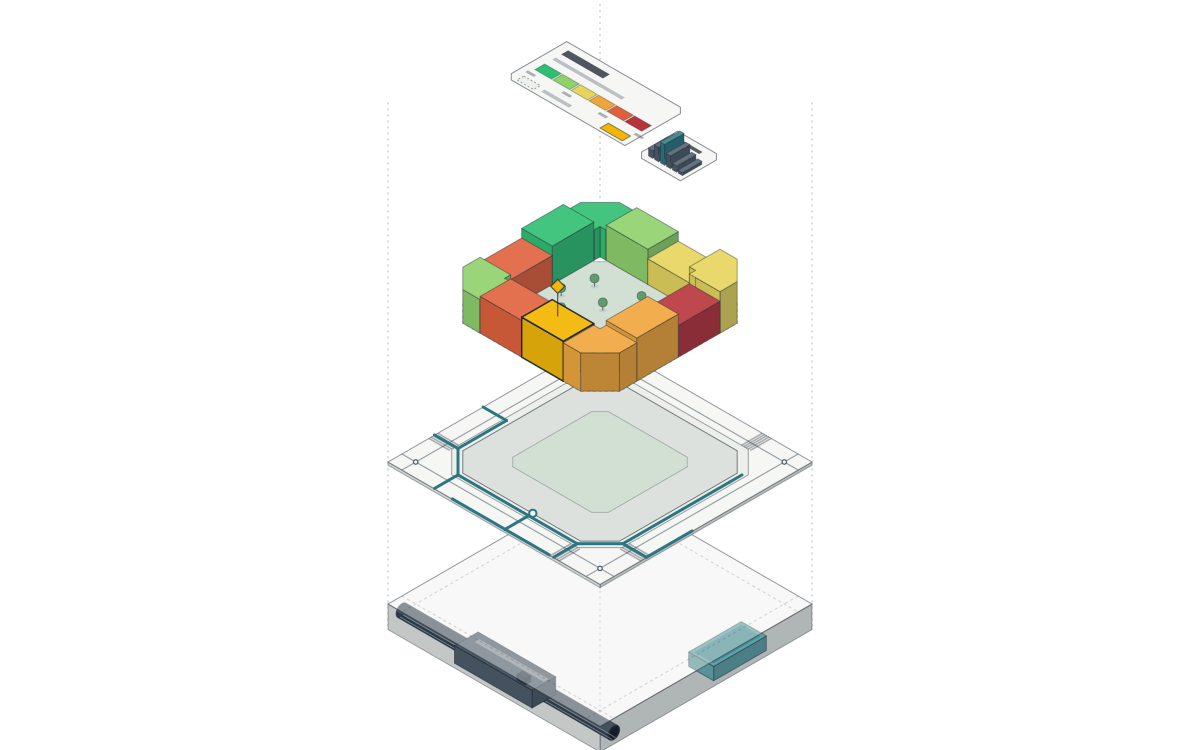
- Metro and bus arrivals · TMBlive
- Trains · FGClive
- Interurban bus · AMB and Generalitatlive
- Bicingobserved
- Rain · Meteocatobserved
- Rivers · ACAobserved
- Trafficobserved
- Air qualityobserved
In the council chamber and on the street
In Catalan, Spanish and English, with keyboard and screen reader. On mobile, the drawer and the card become bottom sheets.
Presentation mode with camera flights, an A4 sheet and a view that can be embedded in the municipal website.
Built to be defended
The rules the viewer follows in every view, every card and every export.
Source and limits on every figure
An unknown value is never painted as zero. The legend carries the year and the method.
Section, not building
A census indicator painted on a building is section context, and the viewer says so.
Measure or scenario
Planning tools carry the label. A scenario is not mistaken for data.
Export with sources
PNG, A4 sheet, CSV and a link that restores the view, the work area and the camera.
Compare two municipalities
A sample of “Municipalities at a glance”, right here and offline: choose two of the 36 municipalities and see them next to the whole AMB with six open datasets. These are the viewer’s values on 3 October 2026, with the source and period of each row.
They differ most, across the range of the 36 municipalities, in net income per person: €19,331 in Barcelona and €13,083 in l’Hospitalet de Llobregat (AMB €17,634).
| Indicator | Barcelona | l’Hospitalet de Llobregat | AMB | Among the 36 municipalities |
|---|---|---|---|---|
| ResidentsINE, annual census · 1 January 2025 | 1,713,24749.7% of the AMB | 292,1618.5% of the AMB | 3,449,761 | Barcelona 49.7% and l’Hospitalet de Llobregat 8.5% of AMB residents. |
| Population changeIdescat, municipal register · 2015–2025 | +7.9% | +14.8% | +7.9% | Position among the 36 municipalities, highest first: Barcelona 15, l’Hospitalet de Llobregat 2. |
| 65 and over% of residents · INE, annual census 1 January 2025 | 21.0% | 18.7% | 20.0% | Position among the 36 municipalities, highest first: Barcelona 5, l’Hospitalet de Llobregat 16. |
| Net income per person€ per year · INE ADRH 2023 | €19,331 | €13,083 (see the note) | €17,634 | Position among the 36 municipalities, highest first: Barcelona 5, l’Hospitalet de Llobregat 34. |
| Rent of new contracts€ per month · Incasòl, rent deposits 2026-Q1 | €1,137 | €824 | €1,071 | Position among the 36 municipalities, highest first: Barcelona 7, l’Hospitalet de Llobregat 24. |
| Registered unemployment% provisional · Observatori del Treball, August 2026 | 7.9% | 8.3% | 8.2% | Position among the 36 municipalities, highest first: Barcelona 15, l’Hospitalet de Llobregat 11. |
Sources. INE: annual population census on 1 January 2025 (residents and 65 and over) and Household Income Distribution Atlas 2023 (CC BY 4.0). Idescat: municipal register on 1 January 2015 and 2025. Generalitat de Catalunya: Incasòl rent deposits for the first quarter of 2026 and the registered unemployment rate for August 2026 from the Observatori del Treball i Model Productiu, provisional, with SEPE data.
Method. Residents are the INE annual census; the change uses the register, a different series. Income is the average of the census sections weighted by 2025 residents, as in the viewer: INE’s municipal figure may differ by up to 5%. The AMB references for income, rent, unemployment and change are derived, because the sources do not publish them. Value with a thin base: fewer than 30 rental contracts in the quarter, fewer than 5,000 inhabitants in 2015 or a section with no income data, which is left out of the average and not counted as zero.
The same method, in other cities
Xamfrà was born in the Barcelona metropolitan area, but the method travels: census sections, facilities on their own building and one question per view. Madrid and New York are already in the viewer as pilots, with fewer sources, and the viewer says which ones are missing.
- Complete
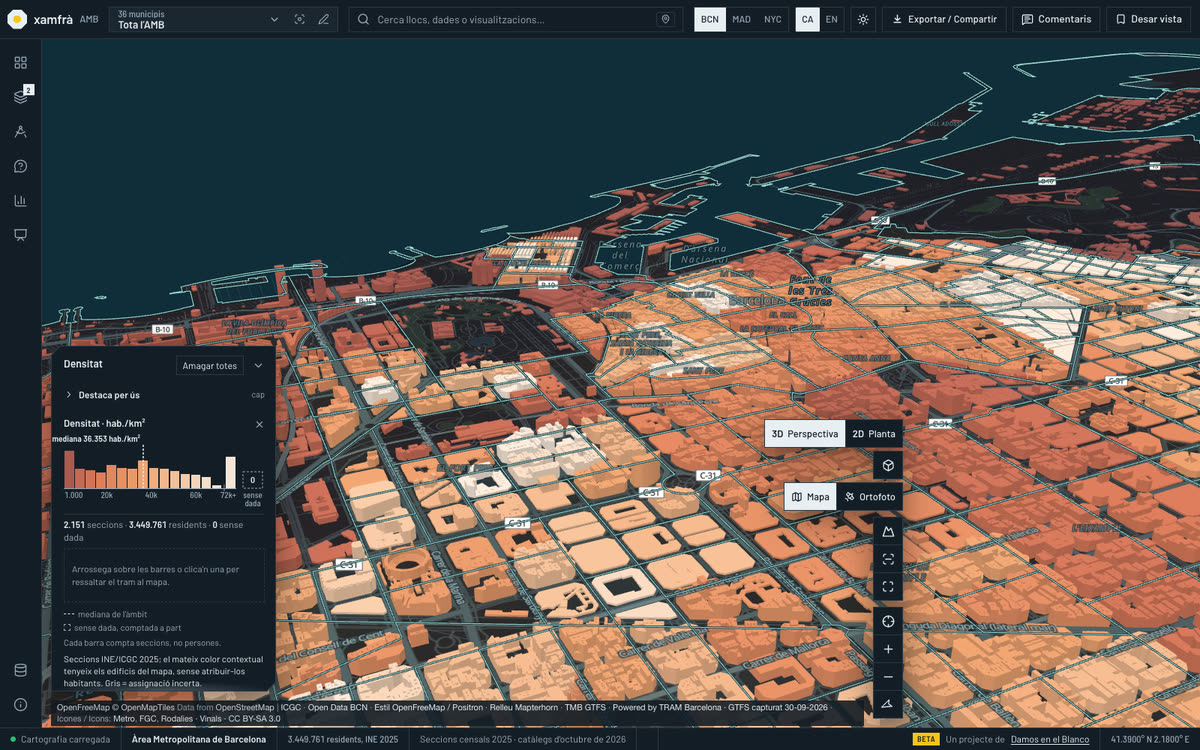
Barcelona metropolitan area
36 municipalities, 2,151 census sections and 192 views, in Catalan, Spanish and English.
Request access - Pilot
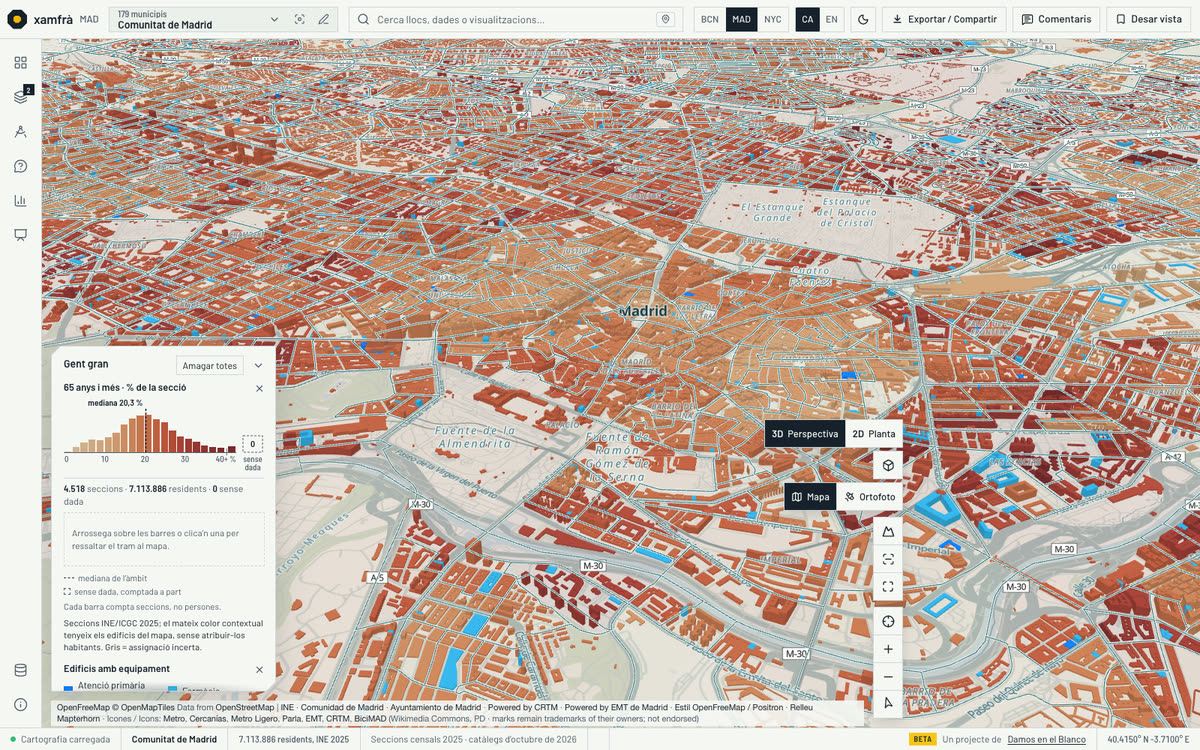
Community of Madrid
179 municipalities, 4,518 census sections and 32 views. 18.9% of residents are aged 65 or over (INE 2025).
Request access - Pilot
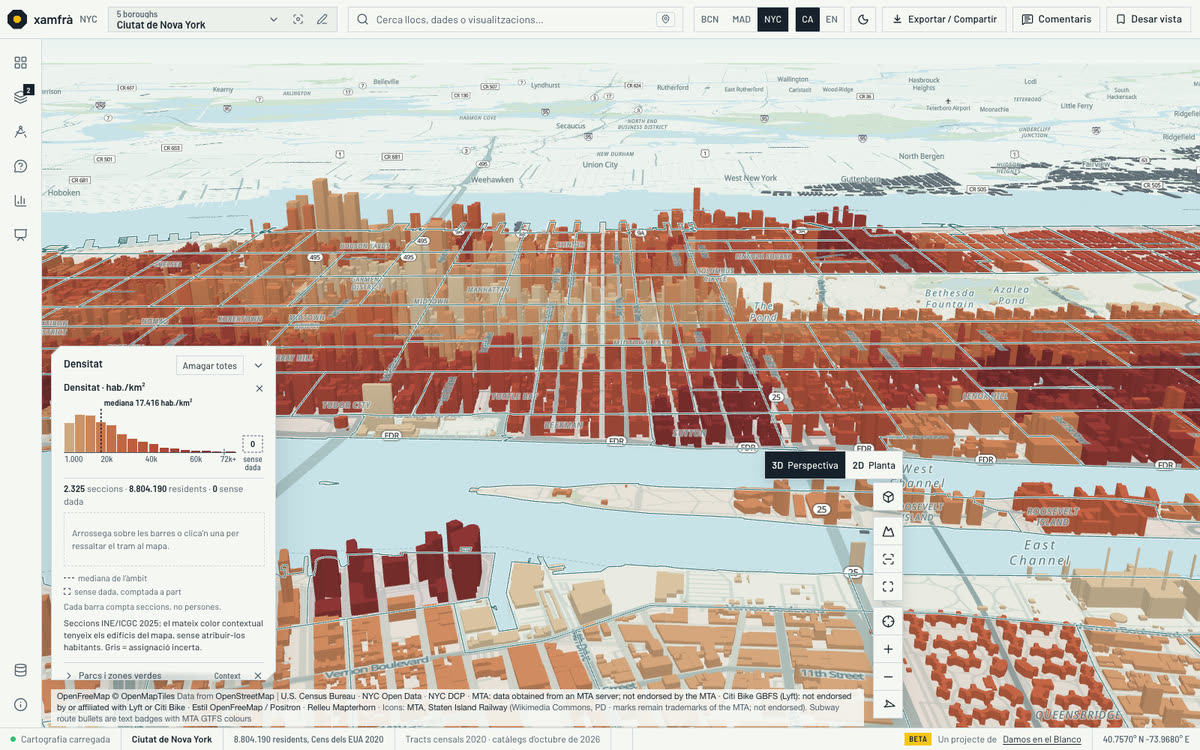
New York City
5 boroughs, 2,325 census tracts from 2020 and 32 views. Median density: 17,416 residents/km² (US Census 2020).
Request access
And your municipality or service area? Let’s talk
We work with you
Xamfrà is a Damos en el Blanco project. Besides the viewer, we help you obtain, publish and analyse the data of the territory where you work.
Data capture with image recognition
Inventories of trees, street furniture or façades from images: automatic detection, human review and delivery as a layer with source, date and licence, ready for the viewer or for your GIS.
Data publication and opening
We prepare your datasets for publication as open data, with manifest, licence and viewer, or we add them to Xamfrà alongside the official sources.
Xamfrà for your territory
Viewer licence for your municipality, county or service area, with your layers, your views and the questions you ask yourself.
Custom analyses
A specific question, such as where to open a service, who lives far from a facility or how a neighbourhood has changed, answered with explicit method, source and limits, and delivered as a view, report or data.
Official data, with date and limits
INE and ICGC (census sections and residents 2025, income 2023, commuting 2023), Generalitat de Catalunya (facilities, health, registered unemployment, tourism register and Incasòl rent deposits), Barcelona City Council (trees, traffic, premises census 2024 and strategic noise map 2022), AMB (consolidated planning 2024, land use 2016 and metropolitan bus), TMB, FGC, Renfe and TRAM (GTFS timetables), Servei Català de Trànsit and OpenStreetMap.
An unknown value is never shown as zero, and a colour on a building is context for its area. Captures with base map © OpenStreetMap contributors, OpenMapTiles and OpenFreeMap.
Method and sources: all 73 sources, municipality by municipality
Let’s talk
Tell us which question you want to answer and for which territory, or what you need from your data. We will reply by email.
Beta programme
Want to use the viewer with real cases?
We are looking for people from public administration and utility companies to test it while we build it.
Request access