Older people
Where do older residents live?
Xamfrà › Views
Each view of the viewer answers a single question about the 36 municipalities of the Barcelona metropolitan area, and in the viewer it carries the source, the year and the limits of the data. Here is the full catalogue, grouped in nine themes and, inside each theme, by view family. The viewer is in private beta.
The label on each view says what the colour on the map belongs to: a building, a census section, a neighbourhood, a municipality, points, street or track segments, zones, flows or a grid. Views marked “new” were added since 5 October 2026.
30 views in 7 families
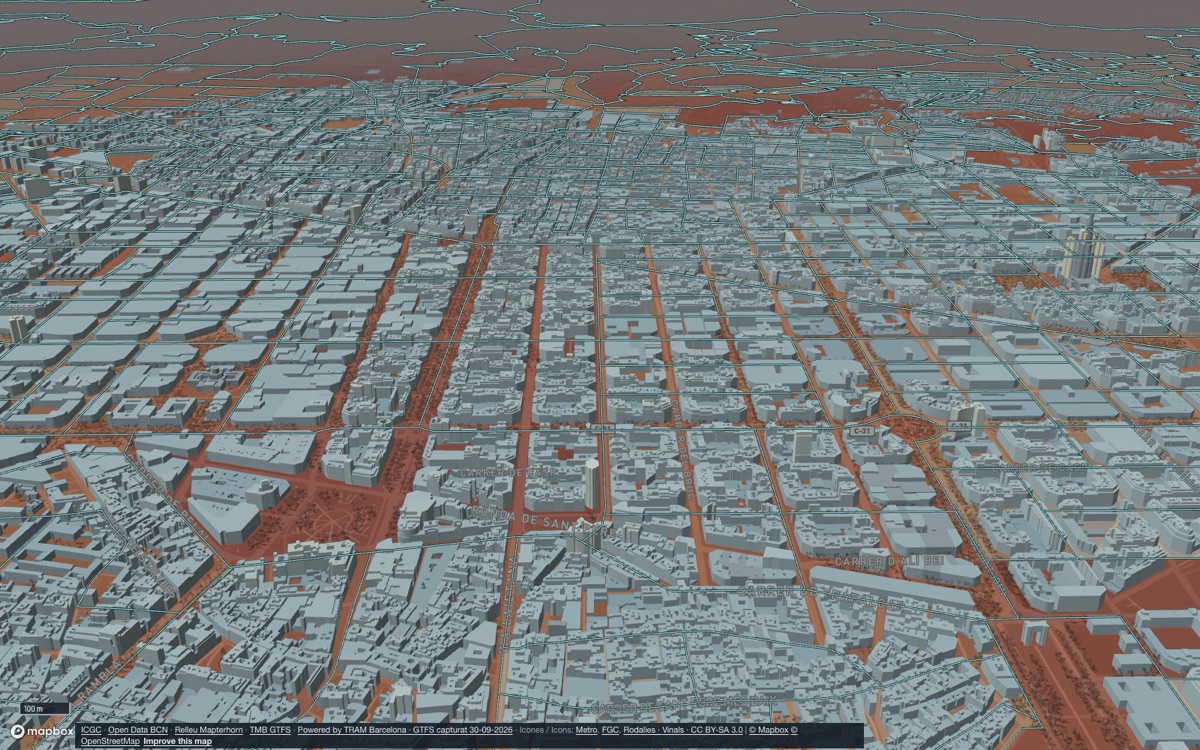
Where do older people live, and how many care places are there?
Where do older residents live?
Where do more people aged 80 and over live?
How many residence and day-centre places are there per 100 people aged 80+?
Where are old buildings in sections with many residents aged 80+?
Where are pre-1980 residential blocks of 4 floors or more in sections with many residents aged 80+?
Where are buildings with no bus stop within 300 m and no station within 800 m in a straight line, in sections with many residents aged 65+?
Where are buildings more than 1 km in a straight line from a primary-care centre, in sections with many residents aged 80+?
Where do most children live, which ones have no play area nearby and where are nursery places short?
Where do most children live?
Where do many children live without a play area within a 300 m walk, and where is it also hot with little shade?
Where do many children aged 0–2 live without a public nursery within a 500 m walk, with low income, more infants and new homes planned nearby?
Where are buildings more than 300 m in a straight line from a park of 0.5 ha or more, and what share of children aged 0–14 does the section have?
Where are buildings with dwellings more than a 600 m walk from a play area, and what share of children does the section have?
Where do most people live, and how are they spread by age and nationality?
Where do most people live per km²?
How are the residents’ age and nationality spread?
Where do more foreign-national or foreign-born residents live, and how widely is Catalan known?
Where do more foreign-national residents live?
Where do more people born outside Spain live?
What share of residents can speak, understand, read and write Catalan, and which language do they use at home?
What education and activity do the residents of each section have?
Where do more people with tertiary education live?
Where do more people who did not go beyond primary education live?
What share of residents of working age work or look for a job?
Where is the share of the active population that is unemployed highest?
How has the population changed, and how may demand for services change up to 2040?
Where has population grown or fallen since 2015?
How could the demand for nurseries, schools, older-people care and home care change by 2030, 2035 and 2040?
What socio-economic position does each section have, which neighbourhoods are most vulnerable and which sections are alike?
How does each section’s socioeconomic position compare with the Catalonia average?
Which neighbourhoods are the most vulnerable according to the official indices, and on what scale?
What is each AMB statistical neighbourhood like: commerce, tourism, work, rent, vulnerability?
Which sections resemble each other?
How many people have a recognised disability or receive social benefits in each municipality?
Views that answer a question of their own, with no family.
Where are there more one-person households?
What were the turnout and the most-voted candidature in each section at the latest elections?
20 views in 4 families
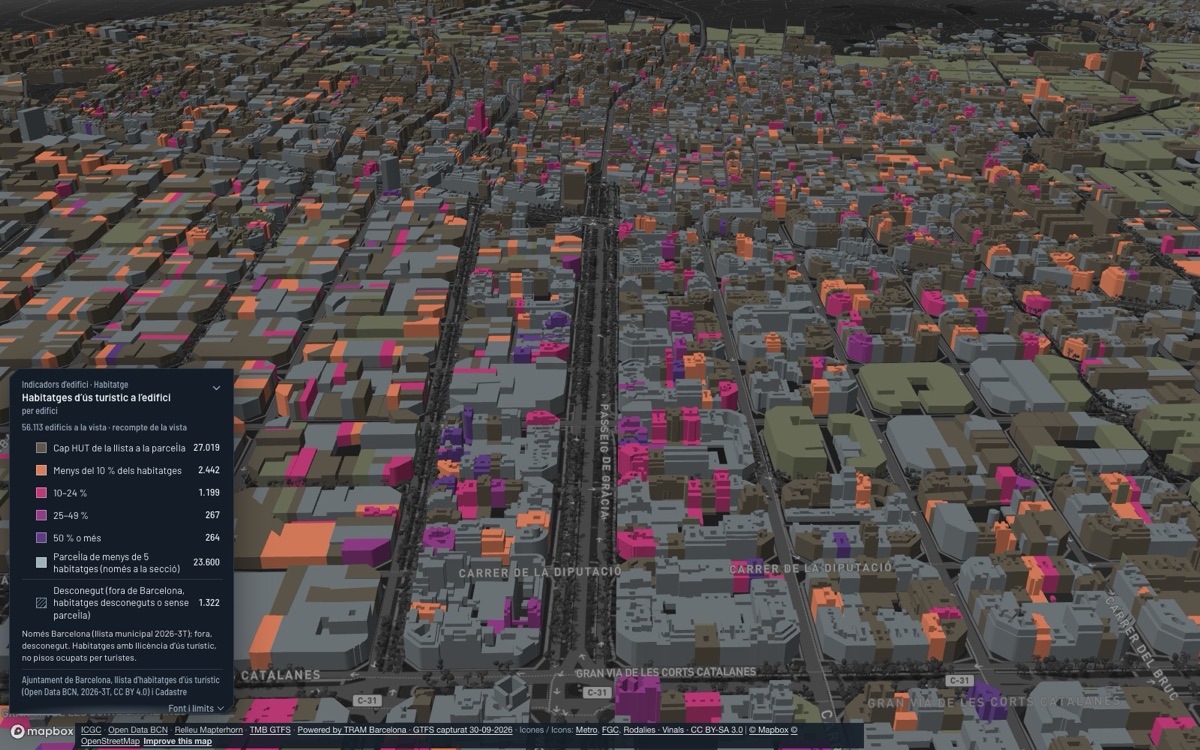
What homes are there, how many are empty or not main residences, who owns them and how dense are they?
What share of dwellings is rented, owned or not a main residence, and how does it compare with the AMB?
Where are there most dwellings with no or very low electricity consumption?
Where are there many non-main dwellings in sections with much renting, rising rents, services and rail nearby?
Who owns Barcelona’s dwellings: people, companies or public bodies?
How many dwellings are there per hectare and how does it compare with the rest of the AMB?
How many tourist flats and hotels are there, where does tourism weigh most on housing and how many visitors does each municipality receive?
Where are tourist-use dwellings concentrated?
Where does tourist accommodation weigh most on resident housing and population, and where do many visitors arrive per resident?
Where are the hotels and other tourist accommodation, of what category and how many places do they have?
How many tourists from elsewhere does each municipality receive, and in which month?
What share of each building’s dwellings are registered tourist flats?
Where are buildings with tourist flats in sections with more rented homes?
What does rent cost, what burden is it and where do conditions associated with displacement risk coincide?
Where is the rent of new contracts highest?
What share of a household’s income would a new rental contract take?
Where do enough conditions associated with residential displacement risk coincide?
How much new and protected housing is built, how much protected demand is there, how many rent aids are granted and how many evictions are carried out?
Where was most new and protected housing built in the last five years?
Per municipality: how much registered demand for protected housing is there, how many emergency cases, what protected stock is in force, how many protected homes are completed and planned, and how many years would cover current registrations?
How many rent-payment benefits are granted per 1,000 households, of what amount, and how many empty dwellings do legal persons and large holders declare?
How many launches do the courts of each judicial district execute per 1,000 households, and of which type?
Views that answer a question of their own, with no family.
Where do inefficient, old dwellings, low income, heat and older residents with many one-person households coincide?
Which neighbourhoods changed most since 2009, and when?
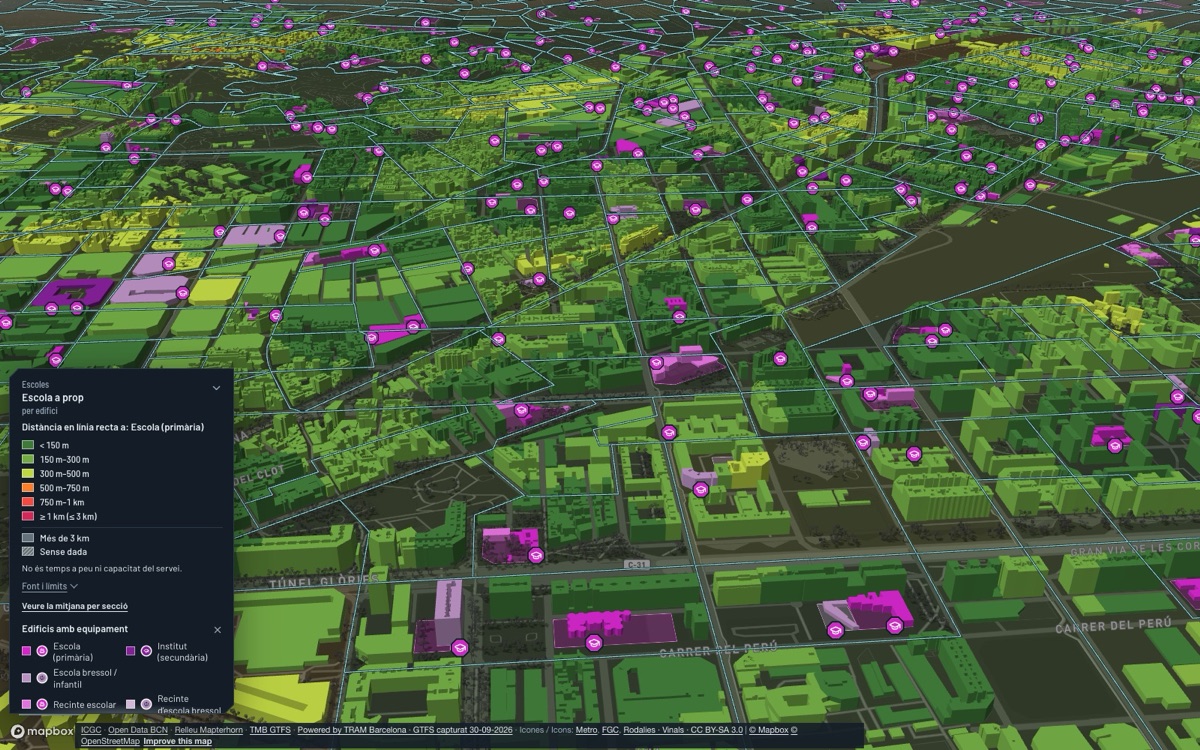
How many basic services are near home, what lies within 15 minutes on foot and where do uses mix?
How many basic services are close to home?
How many basic services do residents have within a 15-minute walk?
Where do housing, shops, work and services mix?
Where are homes with 4 or fewer of the 7 basic services within a 15-minute walk in low-income sections?
Where are the facilities, and how many are there per resident?
Where are the facilities and services?
How many facilities are there per 10,000 residents?
Where are the sports facilities?
Where are the libraries?
Where are the social services centres?
Who lives far from a primary-care centre, a pharmacy or a hospital?
Who lives far from a primary-care centre?
Who lives far from a pharmacy?
Who lives furthest from a hospital?
Where do a basic health area with many residents per CAP, an old population, low income, planned new residents and a CAP more than a 1 km walk away coincide?
Who lives far from a school, and where are places filled?
Who lives far from a primary school?
Where are all places filled at pre-enrolment, and where are some left?
34 views in 8 families
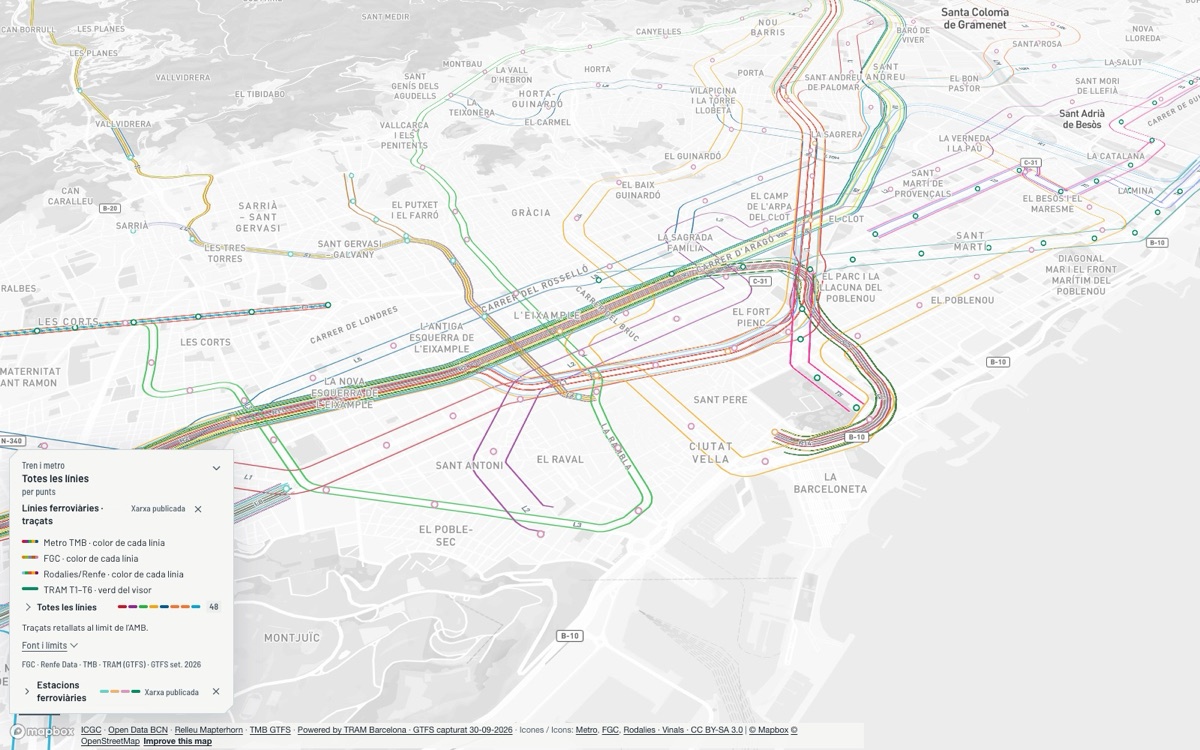
How much public transport is nearby, where is supply short and how many jobs can be reached?
Who lives far from a train, metro or tram station?
How much scheduled public transport is there near each building (stops within 300 or 500 m in a straight line)?
How far, in a straight line, is the nearest train, metro or tram station?
Where is potential demand for public transport high and scheduled supply low?
How many (modelled) jobs can be reached by public transport and walking from each section in the morning peak?
Where do many people travel but public transport is not a competitive alternative?
Where can you ride, where are shared bikes and how many pass by?
Where can you ride a bike?
Where are bikes or docks available now?
How many bikes (and vehicles) are actually counted on the street?
Where do the bikes go in the morning and in the evening?
How much traffic is there now and how many heavy vehicles use the roads, where do crashes happen, which zones restrict polluting vehicles and how many vehicles are there?
Where is traffic congested now?
How many vehicles, and how many heavy ones, use each road, from the AP-7 to the local network?
Where do traffic accidents happen and which are serious?
What lies inside the low emission zone and how many people live there?
How many cars and motorcycles are registered per 1,000 residents, how has the fleet changed since 2015 and which environmental label do they carry?
How many people are killed or seriously injured in road crashes per resident in each municipality?
How many public EV charging points does each municipality have per 1,000 dwellings?
Where do buses run most often, and where does each line run?
Where do buses run most often?
Which bus lines are there and where do they run?
Where do trains run most often, how many passengers use each station and where does each line run?
Where do trains run most often?
How many passengers does each rail station carry?
Which metro, rail and tram lines are there and where do they run?
Which streets are steepest, and which would carry more people according to the shape of the network?
Which streets are uphill?
Which sections have the streets most people would pass through, given the shape of the network?
Where is loading space, how much van demand is there, which logistics parks reach flood zones and where are fuel stations?
Where is kerb space reserved for loading, and how many places?
How many vans and trucks are registered in each section, and how many loading places do they have?
Which business parks, especially logistics ones, have area inside flood zones?
Where are fuel stations, what diesel price do they declare and which logistics parks are farthest from one?
Where are parcel lockers and pickup points, and who lives far from a locker?
How many electrified vans were registered in the last 12 months in each municipality, and how many per 1,000 vans in the fleet?
Where do residents work, and how many trips are there between municipalities on a weekday?
Where do residents work, and where do the people who work here live?
How many trips are there between municipalities on a weekday, at what time and for roughly what purpose?
How many trips are there between AMB districts on a weekday, in which hour band and for roughly what purpose?
How do residents travel between the metropolitan rings: on foot, by public transport or by private vehicle?
25 views in 6 families
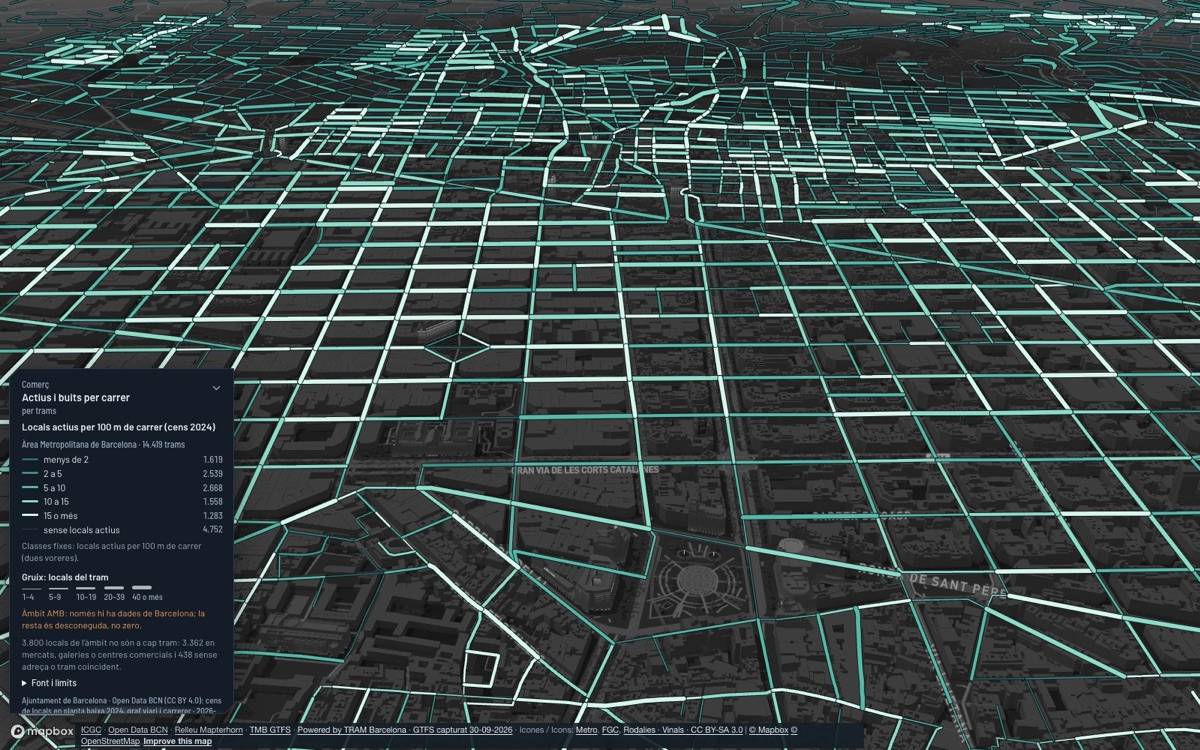
Where is income higher or lower, and where are inequality and poverty risk highest?
Where is income higher or lower?
Where is income inequality highest?
Where do more residents live below the poverty-risk threshold?
Where does income rely most on pensions?
Where are pre-1960 buildings in low-income sections?
How much retail is there, where is it concentrated, which streets have empty premises and how has it changed?
How much commerce does each municipality have per resident, and in which sector?
Which Barcelona neighbourhoods or districts have most active premises per km²?
Where are most ground-floor premises without activity?
What share of each neighbourhood’s active premises is retail?
Which streets concentrate the most active or empty premises?
Where did premises gain or lose activity between 2022 and 2024?
Which ground-floor premises are active and which are empty?
Where are the municipal markets?
Where is unemployment highest, and where has it grown or fallen?
Where is the registered unemployment rate highest?
Where has unemployment grown or fallen in a year?
How many jobs are there, in which sectors, how are contracts changing and where do people train?
Which municipalities attract workers and which are mainly residential?
What is my municipality specialised in?
What share of initial hiring is indefinite?
What vocational training is offered?
Which companies are listed in the municipal directories, which activities hold a licence, and where are the authorised gambling venues?
Which companies and activities are there, and where?
Which activities with a licence or notification appear in the published municipal censuses, and where are they?
Where are the authorised gaming salons, bingo halls and casinos, and how do they relate to Barcelona's hospitality and social profile?
Where has the EU co-funded projects, and how much does each council spend and invest per resident?
Where did the EU co-finance projects in the AMB (ERDF 2014-2020), and of what kind?
How much does each council spend and invest per resident, and on what?
Views that answer a question of their own, with no family.
Which sheds of the economic-activity zones meet the building’s own conditions that make them a place to look first for renewal?
26 views in 5 families
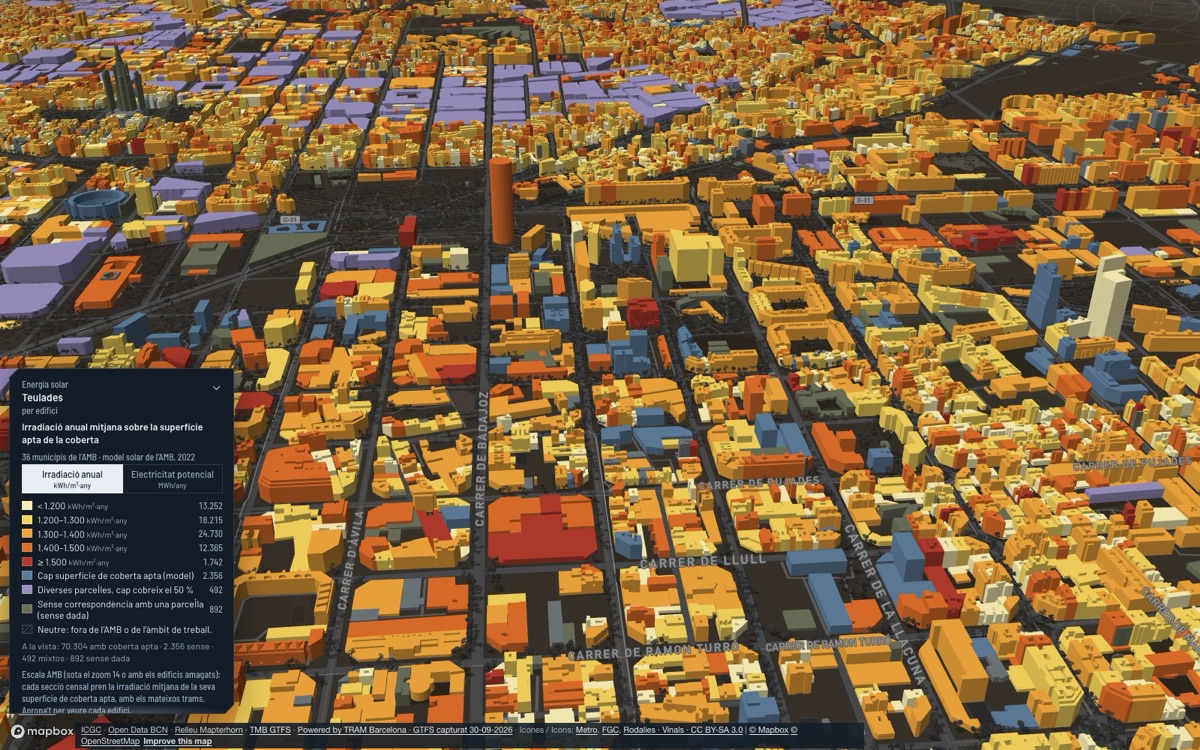
Who lives far from a climate shelter, where is shade lacking, which areas and people are most heat-vulnerable and where does the surface heat up most?
Who lives far from a climate shelter?
Which squares and yards have the least shade on a summer afternoon?
Which areas combine more heat-wave exposure with more sensitive people or homes?
Where do many very old residents, often alone and on low incomes, live in hot sections far from a climate shelter?
Which sections heat up most at the surface in summer, as seen from the satellite?
Which residential buildings from before 1980 have a measured flat roof, where a cool, green or solar roof can be looked at first?
How many tropical nights and hot days does each municipality have on average, and how much rain falls?
Where is the green, who has a park nearby, how much tree cover is there, how much soil is sealed and which roofs are green?
Where are the parks, green areas and trees?
Who has no park nearby?
How much of each section’s urbanised land is under tree canopy?
Which Barcelona sections have more street trees?
How much of each section is sealed, and where did it grow between 2021 and 2024?
Where is there roof to green where it is hottest?
What air quality do the stations measure, and where is it noisiest?
What air quality do the stations measure today?
Which streets have the worst air, and has it improved since 2018?
Where is it noisiest according to the strategic map?
Which buildings lie inside the airport noise contours?
How much is collected separately, where are the recycling points and how much water is used at home?
What share of waste is collected separately and how many kg does each resident generate?
Where are the recycling points?
How much water does each resident use at home per day, and what does a cubic metre cost in each municipality?
How many recycling centres does each municipality have per resident, and how far are they?
What solar potential do rooftops and facility roofs have?
Which roofs have the most solar potential?
What modelled solar potential do parcels associated with facilities have?
Which roofs in the AMB meet the conditions for shared self-consumption with the dwellings nearby?
Where are large solar-ready roofs in sections with a higher poverty risk?
How much photovoltaic self-consumption capacity is registered in each municipality, and how has it grown?
21 views in 6 families
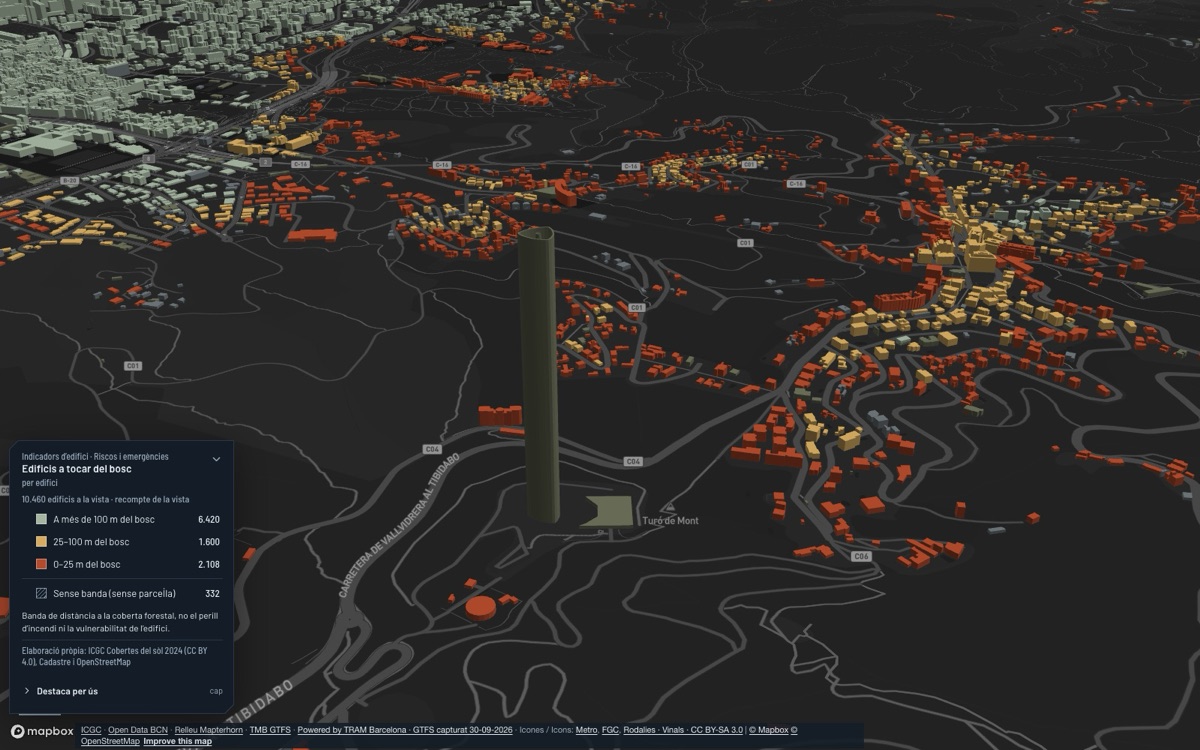
Which areas and buildings lie in flood zones, and where do the rivers and streams run?
What lies inside the official flood zones and how many people live in the affected sections?
Where does water run: rivers, streams and canals, and which sections are buried?
Which buildings lie in a river flood zone?
Where are buildings in T100 or T10 flood zones in sections with many residents aged 65+?
Which buildings with floors below ground lie inside a mapped flood zone (T500, T100 or T10)?
Who lives exposed to a hazard, and which sensitive facilities have flooding, noise or hazards nearby?
How many residents, of which ages, live in a flood zone or in sections highly vulnerable to heat?
Which schools, residences, primary-care centres and hospitals are in a flood zone or in noisy sections?
What do flood, heat and shelter-access data show around facilities?
How many mapped physical exposures does the building have?
How long do emergency services take to arrive, where are defibrillators, how many interventions do firefighters make and which plans exist?
How long would a fire engine take, in the model, to reach each section from the nearest station, and how many people are further away?
How far in a straight line is each building from the nearest registered defibrillator, and which areas are left far away?
Which municipalities have up-to-date civil protection plans for the risks that oblige them?
How many urgent interventions do the Generalitat fire service make in each municipality per resident, and of what kind?
How many offences do the Mossos record in each police area, and how many incidents does the City Police handle in each neighbourhood?
How many offences do the Mossos know of in each police area per 1,000 residents, of what kind, and how are they changing?
How many incidents does the City Police handle in each neighbourhood, of which type, and where are municipal cameras?
Where is the chemical industry, where do dangerous goods travel and what seismic intensity does each municipality have?
Where are Seveso establishments and which sensitive facilities are nearby?
Where do dangerous goods travel, with which hazard level in the TRANSCAT plan, and what is nearby?
What seismic intensity does each municipality have, and how many dwellings predate 1980?
Where are buildings close to forest, what is the fire danger today and which historical fires occurred?
Which built parcels are near mapped forest?
What forest-fire danger level does each municipality have today and tomorrow, and which fires occurred in 2025 and 2026?
Which historical fires and perimeters occur in the work area?
28 views in 6 families
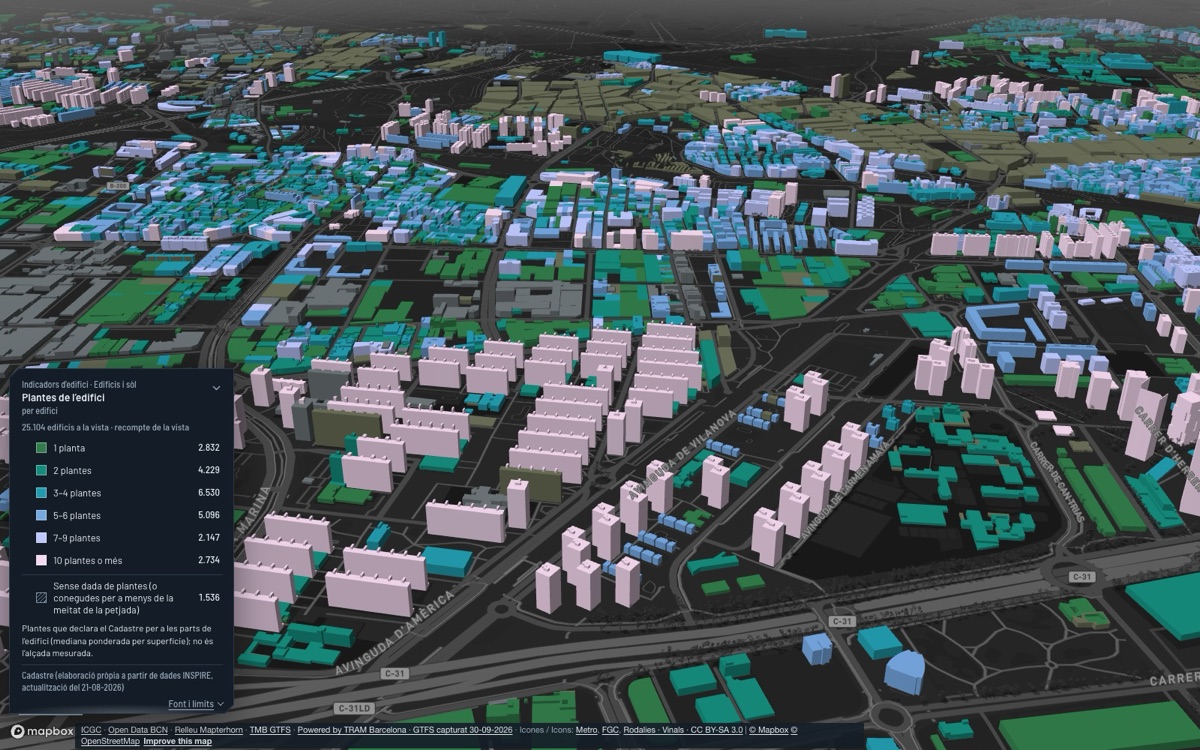
When were the buildings built, what are they used for and how tall are they?
When were the buildings built?
What are the buildings mostly used for?
What is the building stock used for and when was it built?
Where are the tallest buildings?
How many floors does each building have?
Up to how many floors does each building rise?
How much floor area does each building have?
Which buildings are recorded as declined or in ruin in the Cadastre?
Where are buildings of 7 floors or more, and how dense is their section?
Which residential buildings are 45 years old or more, the age at which the technical building inspection (ITE) applies?
Which residential buildings are clearly lower than the parcels of their zone around them?
How efficient are the buildings, which ones have rehabilitation conditions and where are works under way?
Where are more certified dwellings rated E, F or G?
Which consumption letter prevails in each parcel’s energy certificates?
What share of each parcel’s energy certificates is F or G?
Which buildings are residential and predate 1980, and how many energy-poverty criteria does their section meet?
Does the building meet its own conditions that make it a place to look first for rehabilitation?
Which pre-1980 residential buildings stand in the sections meeting more energy-poverty criteria?
Where are buildings being built, enlarged or refurbished?
Which elements and buildings have heritage protection?
Which buildings and elements have recognised heritage value, and in which source?
Where are Barcelona’s Civil War air-raid shelters recorded?
Which buildings hold a catalogued heritage element?
Which signs of activity are recorded at each building?
Are there recent signals of works, renovation or activity at the building?
How many OSM activity points does each parcel have, and of which families?
Which observed land uses and land parcels are recorded?
Which agricultural uses and DUN declarations occur in the work area?
What was the land used for in 2016?
Which urban parcels have no building in the Cadastre and how much land do they take?
Where are fibre-cement roofs recorded, and what radon context does each municipality have?
Where are fibre-cement roof detections concentrated?
Which municipal zoning and territorial radon potential are recorded?
20 views in 4 families
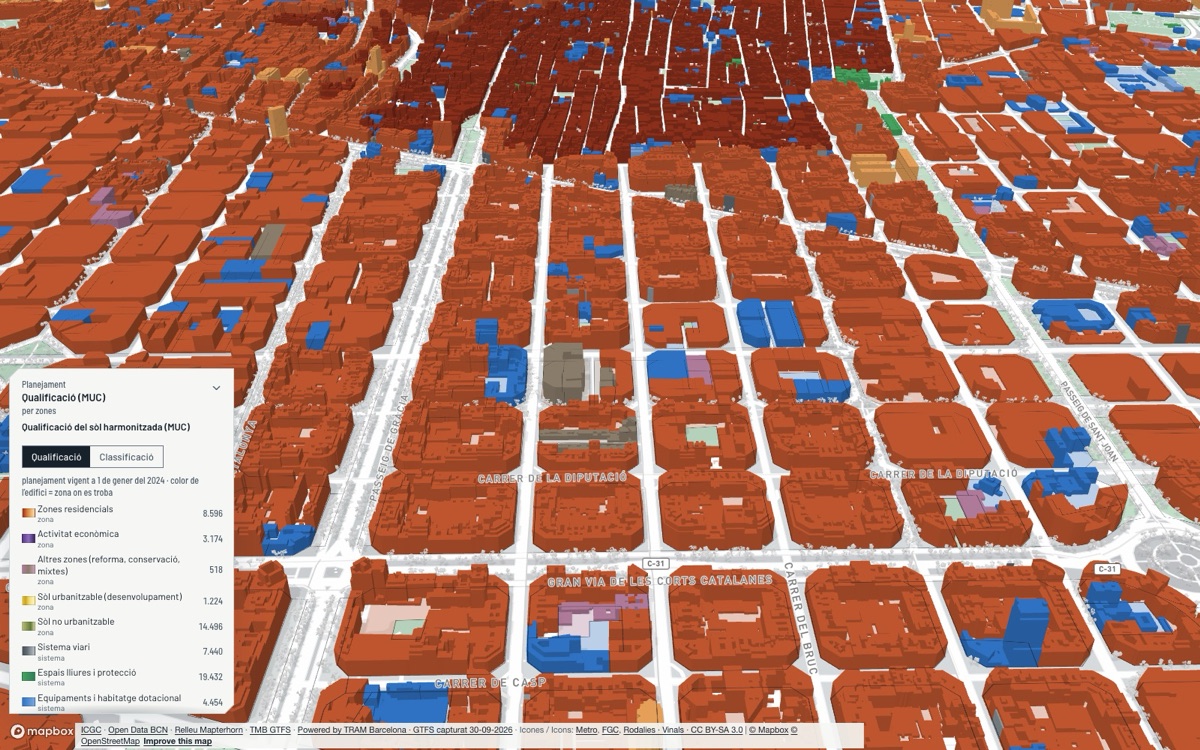
Where does activity concentrate, how has it evolved and how much productive land is gained or lost?
Where are the economic activity poles and what type are they?
When did the AMB activity poles appear and how have they grown since 1965?
Where are the business parks and how occupied are they?
How much economic-activity land would be converted and how much is gained, by municipality and corridor?
What connects campuses and research with industry and the city?
What connects the campuses and research centres with industry and the city around them?
Who produces scientific knowledge in the AMB, and with whom?
Which organisations run EU R&D&I projects, and who do they work with?
Where are the research centres?
Where is land planned to grow or transform, new centralities and station areas with potential?
Where are there opportunity signals, which constraints weigh on them, and what should be prepared to plan them well?
Which land is planned to grow or transform, which activity land could change, and with what risks?
Where are today’s centralities, where does the PDU propose new ones and which have the ingredients to take hold?
Which station areas are well served but under-used, and where does planning already foresee growth?
Where are unbuilt urban parcels close to rail, with daily services and no flood risk, where housing pressure is high?
What does planning say for each zone and each building, which plans are in process and which equipment land has no facility?
What is the approved zoning here?
What harmonised zoning does this area have and how many hectares does each kind of land take?
Where is there equipment land with no catalogued facility?
Which planning files affect this area: which are approved and which are in progress?
What zoning does each building stand in?
Which land class does each building stand on?
Which buildings are inside the ambit of an approved file, and from which year is the latest?
The viewer is in private beta. Request access and we’ll give you a login to try it on your own municipality.