xamfrà a project by Damos en el Blanco CAENES Enter the viewer

Xamfrà › Use cases

Eight questions the viewer already answers

Who uses it, what they ask, what Xamfrà shows them and what it cannot say. The figures in the text are those of the viewer on 5 October 2026 and may change when the data is updated; the screenshots and loops date from 3 October 2026 and may show earlier figures.

  1. 1Older people far from a CAP
  2. 2Children far from school
  3. 3Climate shelters nearby
  4. 4Public transport, street by street
  5. 5Rent and tourist-use dwellings
  6. 6Local commerce
  7. 7Zoning, heights and massing
  8. 8Explaining it to the council plenary

A case, step by step: “Who lives far from a CAP?” in Barcelona

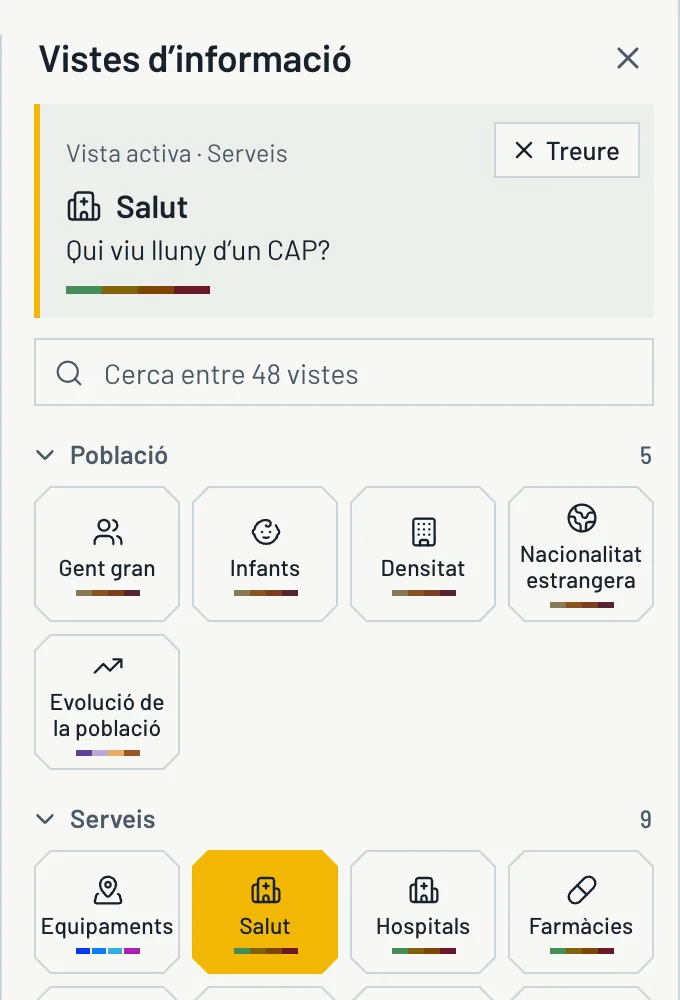
  1. Viewer views drawer with the Health view selected in yellow.
    1Choose the question

    In the Barcelona area, the views drawer and Health. The area can also be the whole AMB, a district or a drawn area.

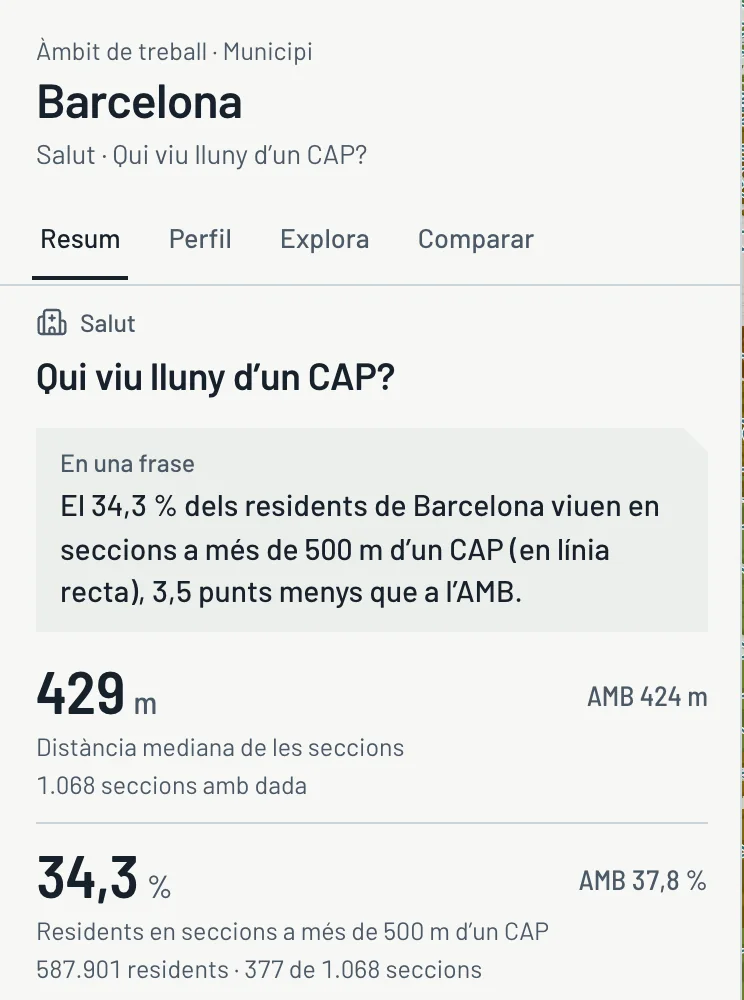
  2. Barcelona summary panel: “In one sentence”, a median of 429 metres and 34.3% of residents and 34.9% of older people more than 500 metres from a CAP, with the AMB reference.
    2Read the answer

    “In one sentence”, the median and the residents and older people more than 500 m from a CAP, always next to the AMB figure.

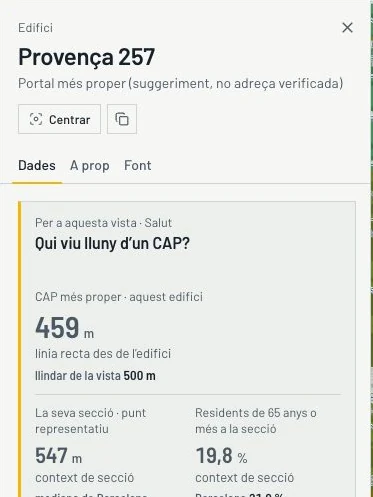
  3. Card for the building at Provença 257 with the Health view: 459 metres to the nearest CAP, 547 metres to the section point, 19.8% older people in the section and the medians for Barcelona and the AMB.
    3Go down to the building

    One click gives the address and that building’s distance to the nearest CAP, and compares it with the section, Barcelona and the AMB.

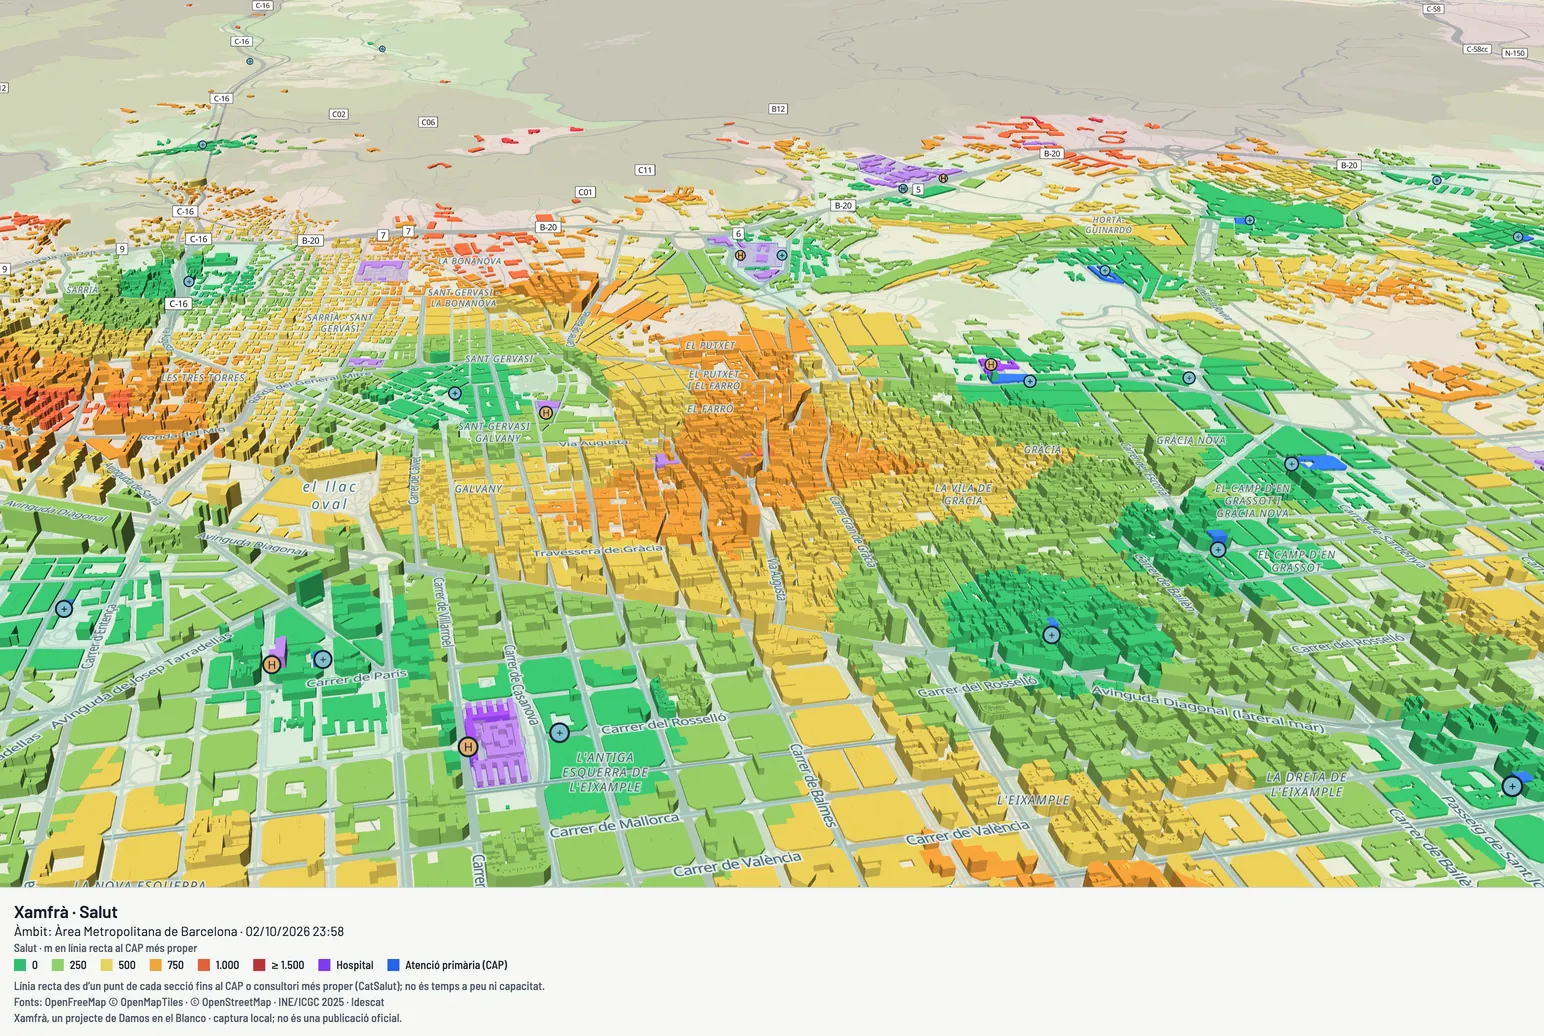
  4. PNG image exported by the viewer: the Health view map with the title, the area, the legend and the sources at the foot.
    4Take it with you

    A PNG with title, legend, sources and date, or a CSV per section, ready for the report or the plenary.

Case 1 · Public health

Older people far from a CAP

For: health and older-people services of town halls, regional health planning.

“Who lives far from a CAP?” and, crossing data, “Where do older people live far from primary care?”

What you see
Each building takes the colour of its straight-line distance to the nearest CAP. The panel gives the median of the sections (Barcelona 429 m, AMB 421 m), the percentage of residents and of older people in sections more than 500 m away (Barcelona 34.3% and 34.9%; AMB 37.3% and 36.6%) and the ranking by district. A click on a building opens its card for this view.
Views and tools
Views › Health · Explore › Cross · building card · area card in PDF
Limits
Straight-line distance, not walking time. Facilities catalogue of October 2026; INE 2025 census sections.
Building card for the view

With the Health view, a click on a building opens its card: the address, the distance to the nearest CAP and the reference for Barcelona and for the AMB.
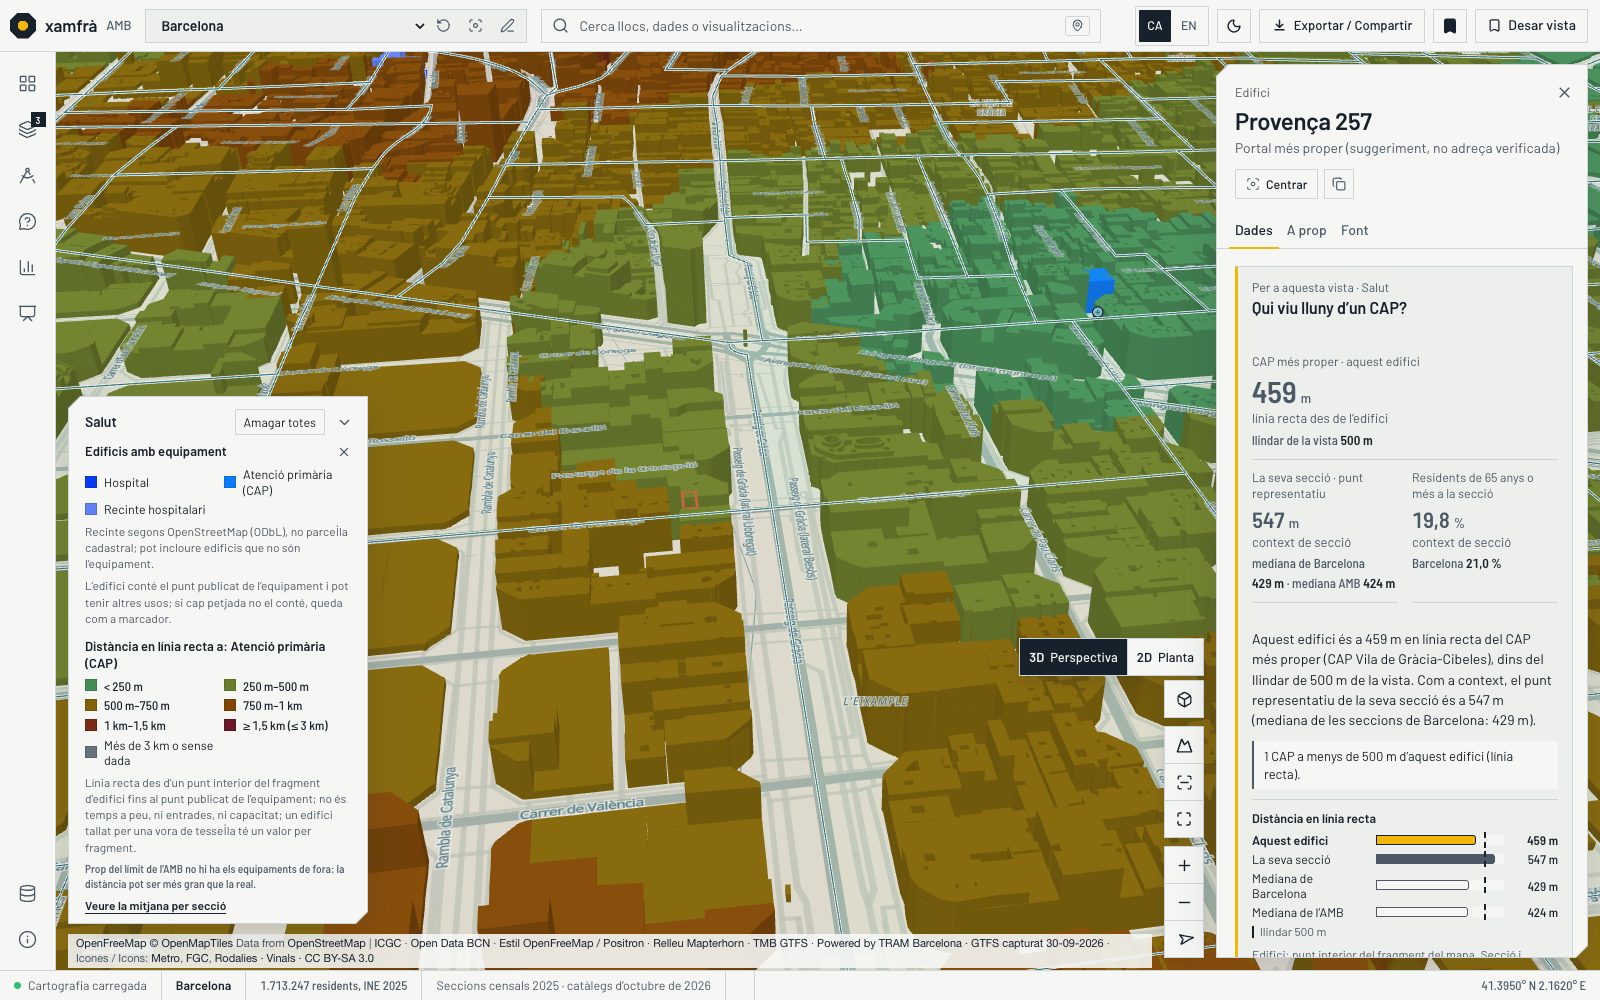
Card for the building at Provença street 257 with the Health view: 459 metres to the nearest CAP, 547 metres to the section’s representative point, 19.8% older people in the section and the medians for Barcelona and the AMB.
Building card: Provença 257

With the Health view, the building card gives the straight-line distance to the nearest CAP (459 m) and compares it with the section and with Barcelona.
Case 2 · Education

Children far from school

For: education departments, education consortia and school planning.

“Who lives far from a primary school?” and “Where do many children live far from a primary school?”

What you see
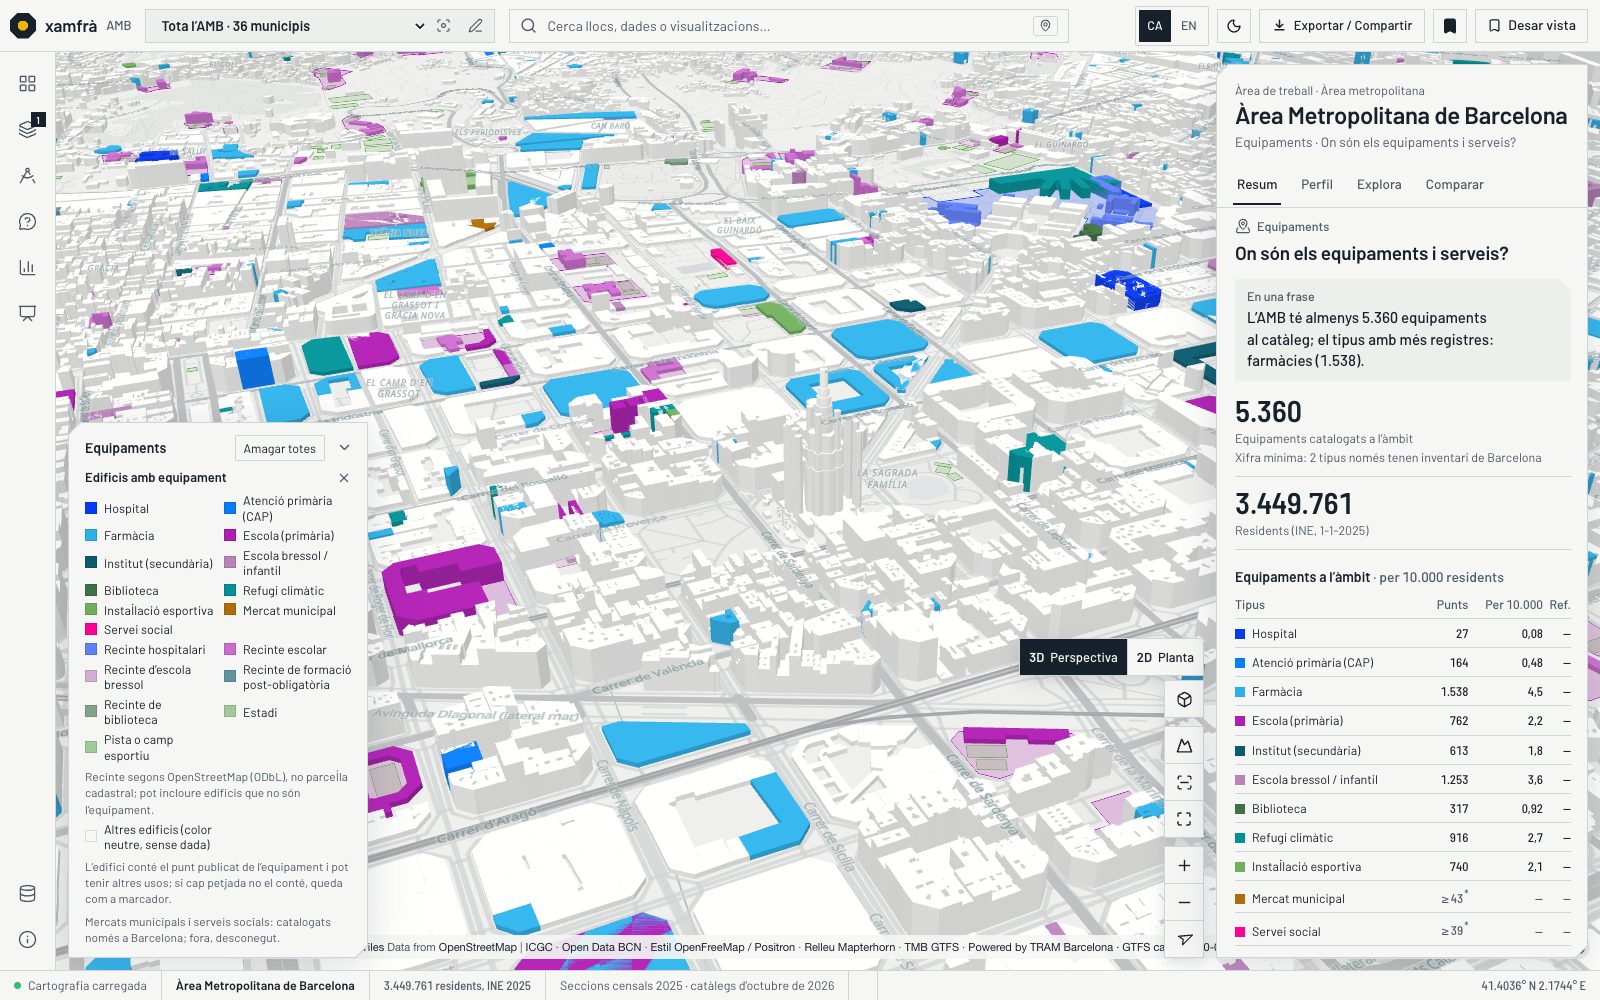
The distance from each building to the nearest primary school, where most children live (Children view) and schools, secondary schools and nurseries painted on their own building.
Views and tools
Views › Education, Children and Facilities · Explore › Cross (children × school)
Limits
Straight line; the catalogue gives neither places nor an official catchment area.
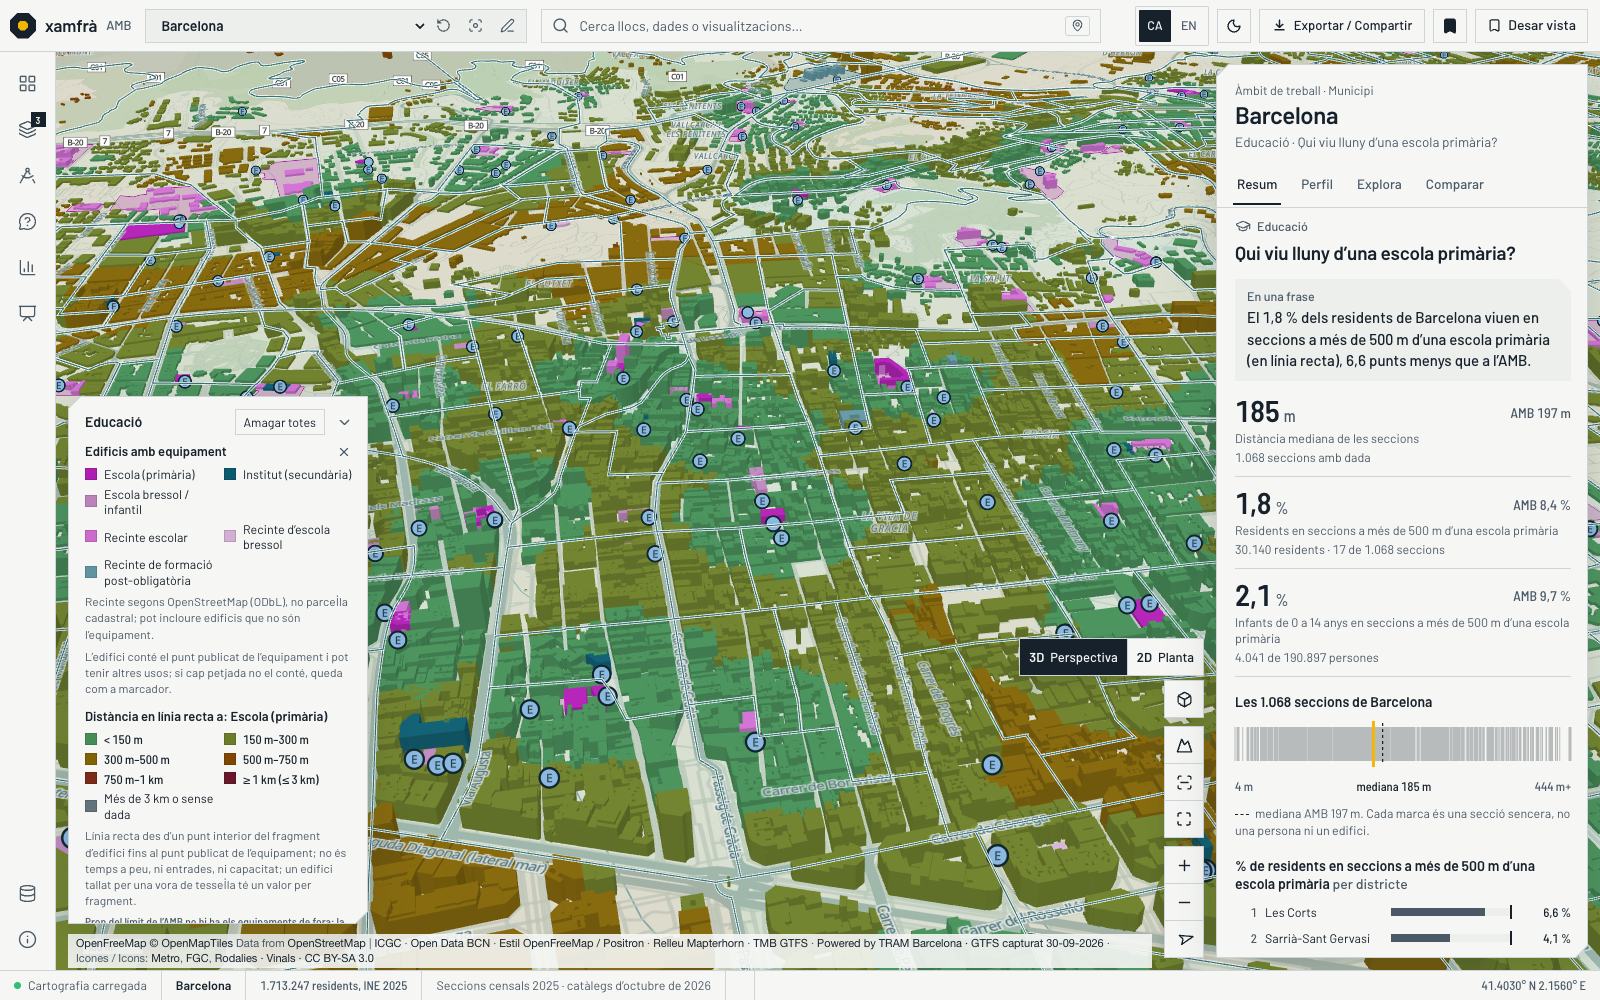
Education view in Gràcia: buildings in greens and ochres by distance to the nearest primary school and educational centres in magenta, with the figures in the panel.
Education

Distance from each building to the nearest primary school; schools and secondary schools painted on their own building.

Facilities view at the Sagrada Família: buildings coloured by the type of facility they contain, among neutral buildings, with the count by type in the panel.
Facilities on their own building

Schools, CAPs, pharmacies, libraries or shelters painted on the building that contains their published point, and their grounds.

Case 3 · Heat and emergencies

Climate shelters nearby

For: public health, environment and emergencies.

“Who has a climate shelter far away?” and “Where do older people live far from a climate shelter?”

What you see
The distance from each building to the nearest climate shelter; crossings of older people and of income with that distance; urban green, access to parks and street trees. The facilities simulator tests a new shelter and counts who is far away before and after.
Views and tools
Views › Heat, Urban green and Park nearby · Explore › Cross · Planning › Facilities simulator
Limits
The scenario is hypothetical and does not change the official data; shelters according to the published catalogue.
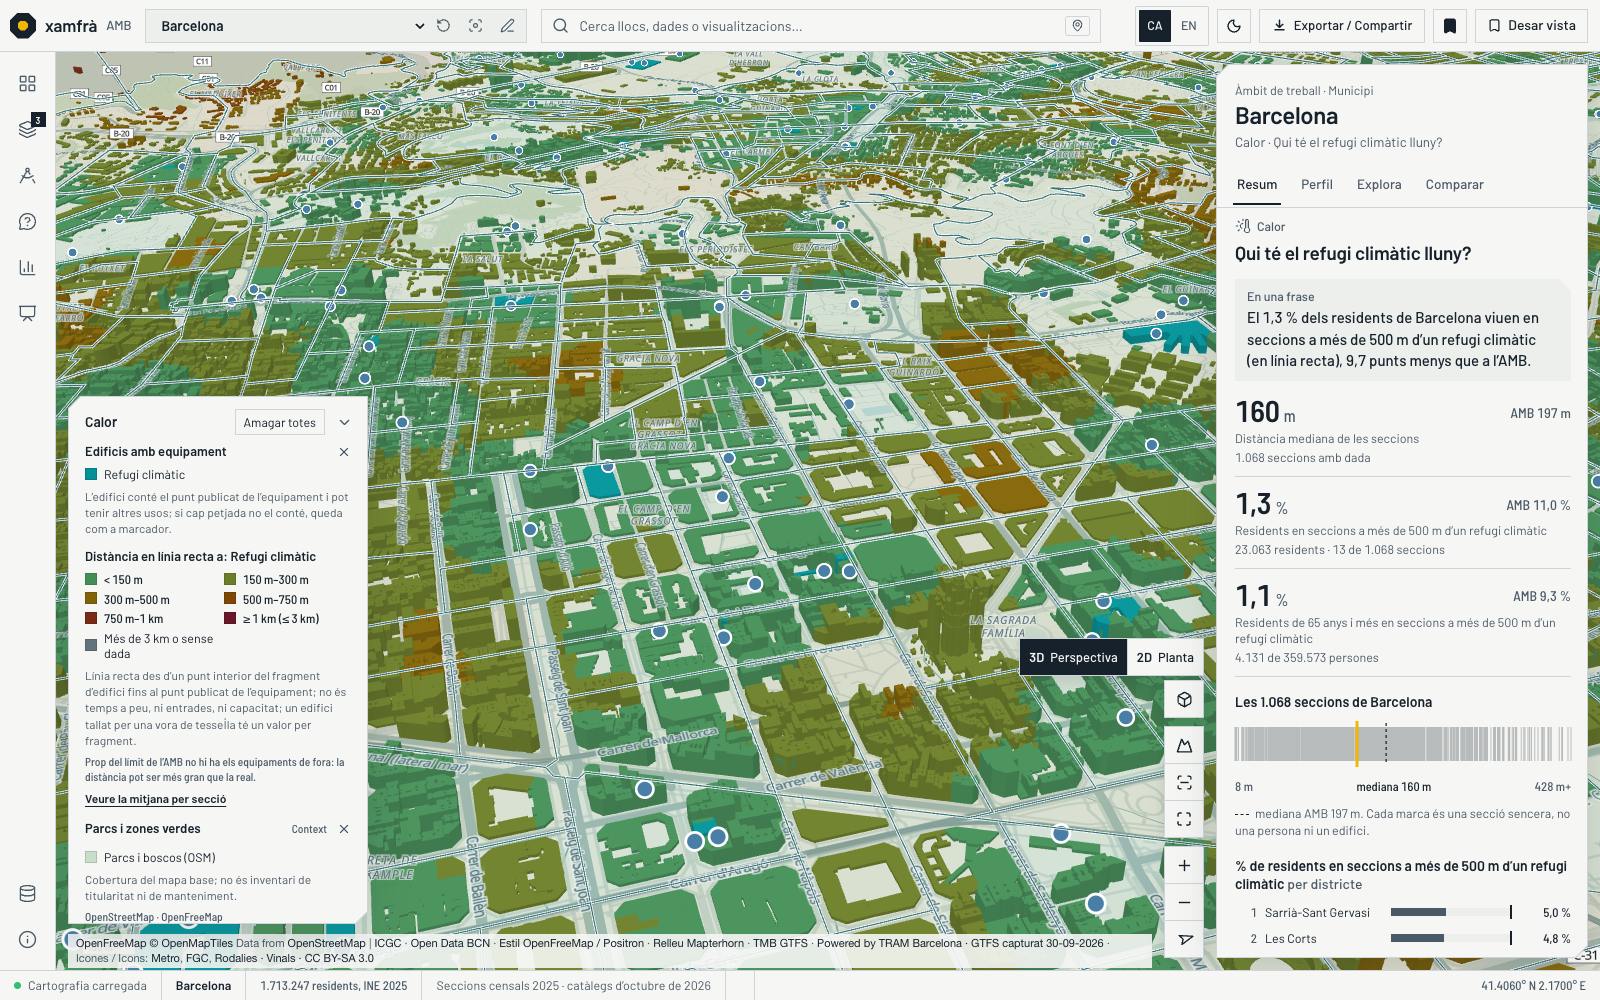
Heat view in Gràcia and the Eixample: buildings coloured by distance to the nearest climate shelter and the shelters as dots, with the median in the panel.
Heat and climate shelters

Distance from each building to the nearest climate shelter, with the shelters marked.

Facilities simulator: before and afterTwo plans of fifteen blocks coloured by distance to the nearest CAP. Before, with a single CAP in the west, the blocks in the east are orange and red; after adding a hypothetical CAP in the east, marked with a yellow circle with a dashed outline, those blocks turn green.newBeforeWith a hypothetical CAPclosefarThe simulator counts, in the area,how many people are far away before and after.
Facilities simulator: before and after. Diagram, not a capture.

Case 4 · Mobility

Public transport, street by street

For: transport operators and authorities, municipal mobility services.

“Where do buses run most often?”, “Where do trains run most?” and “Where do those who live here work, and where do those who work here come from?”

What you see
Scheduled bus trips per hour on each street segment (TMB and AMB combined) with the day profile; rail frequency; the focus of a line with its stops; AMB bus trails by timetable; commuting from the 2023 census and live traffic in Barcelona.
Views and tools
Views › Bus frequency, Rail frequency, Commuting and Traffic · line focus · Planning › Stops and lines simulator
Limits
Scheduled supply on a weekday, not passengers or vehicle positions; the trails are the timetable; commuting counts people, not trips.
Line focus

A click on line H12 switches the city off and leaves only the line, with its colour and its stops; “Leave focus” restores it.

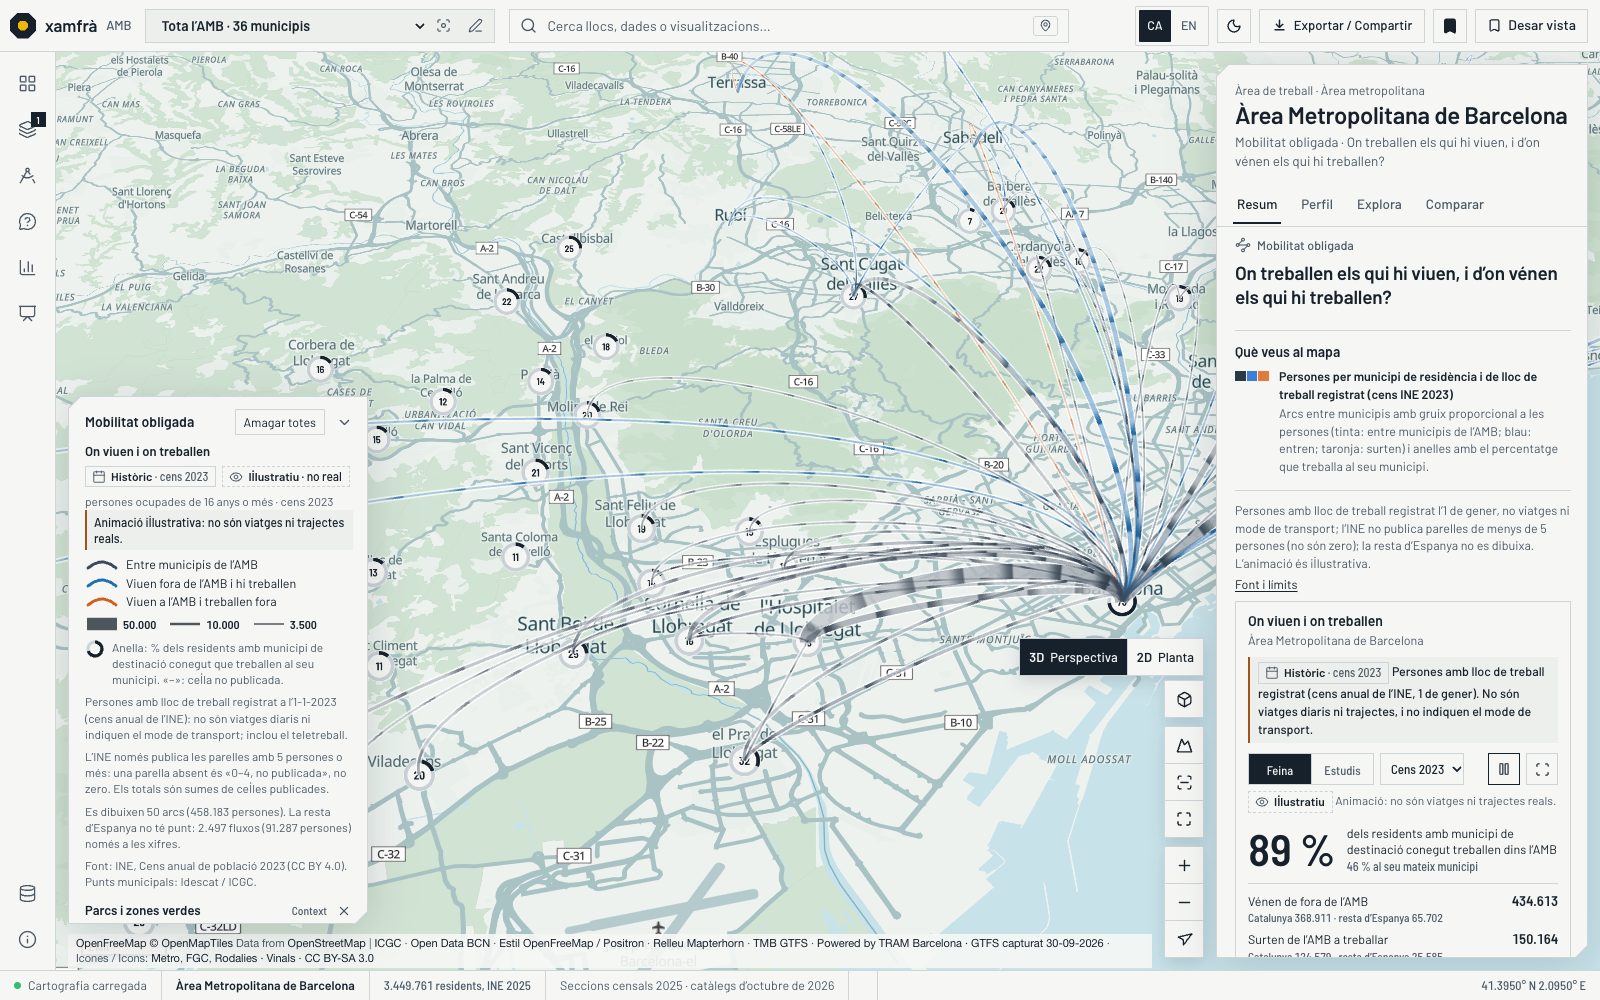
Commuting view: arcs towards Barcelona with thickness proportional to the people who work there and rings with the percentage who work in their own municipality.
Commuting

Where those who live in each municipality work and where those who work there come from, according to the 2023 census. These are people, not trips.

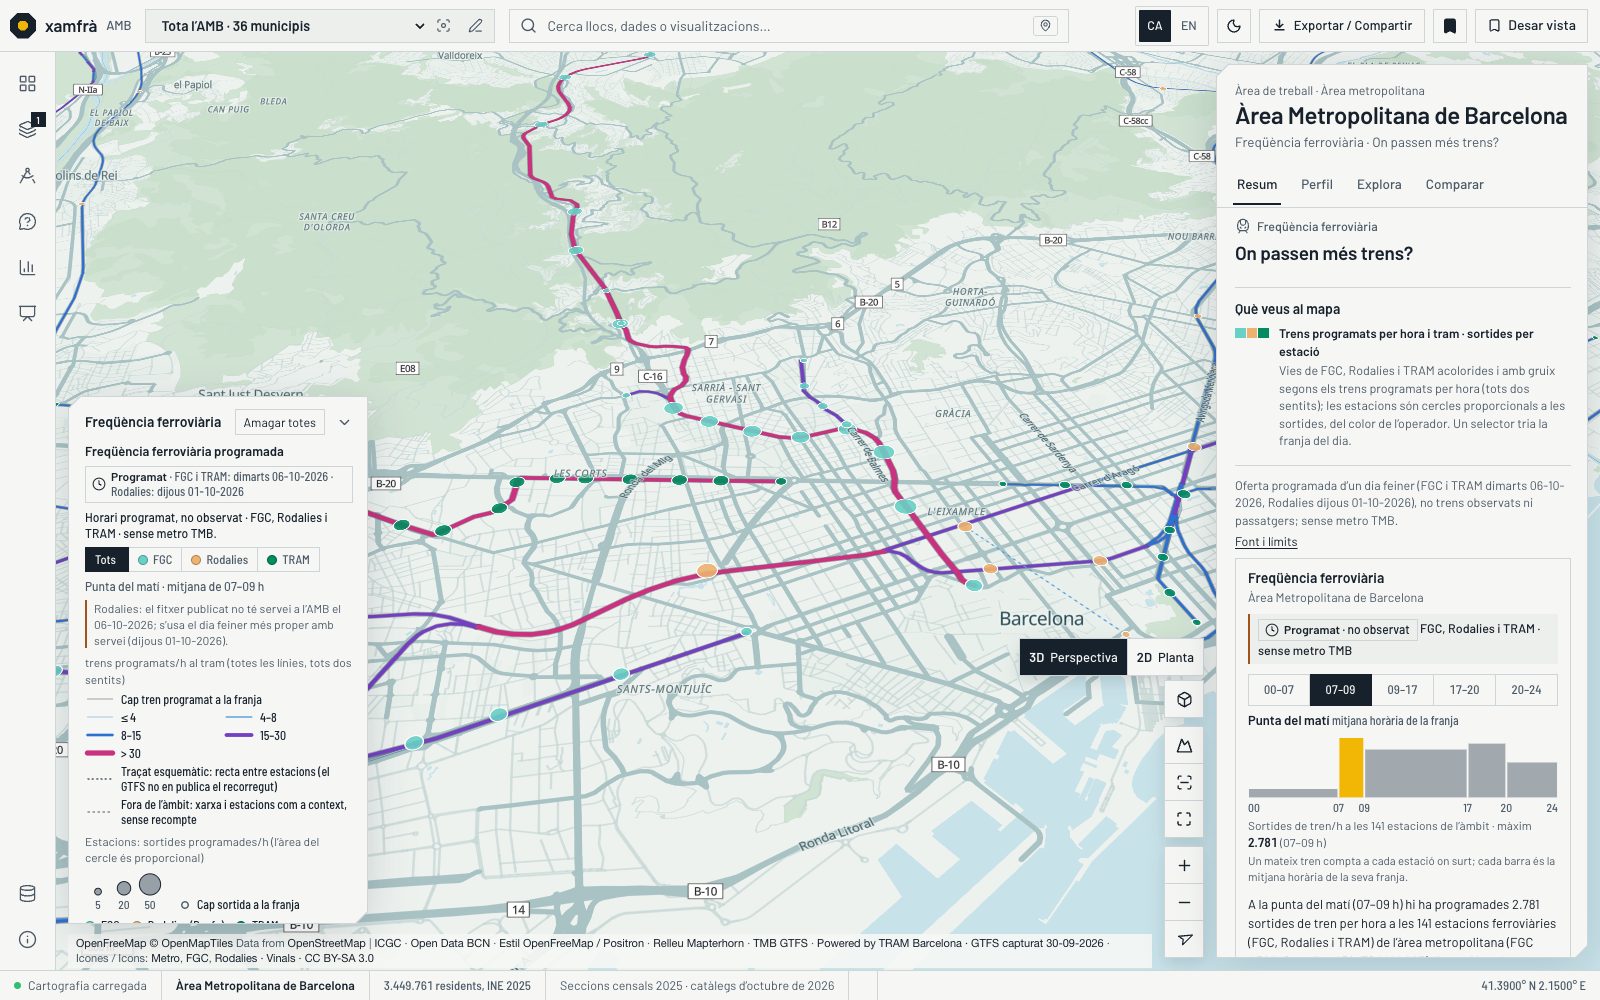
Rail Frequency view over the AMB with lines coloured and thicker according to scheduled trains per hour and the day profile in the panel.
Rail frequency

Scheduled trains per hour on each FGC, Rodalies, metro and TRAM segment.

Case 5 · Housing and tourism

Rent and tourist-use dwellings

For: housing departments and metropolitan and municipal observatories.

“Where is rent highest for new contracts?” and “Where are tourist-use dwellings concentrated?”

What you see
The average rent of new contracts by neighbourhood (Incasòl deposits, first quarter of 2026) and the year-on-year change; tourist-use dwellings per 1,000 residents in each section of Barcelona; income, inequality and population change year by year.
Views and tools
Views › Rent, Tourism, Income, Inequality and Population change
Limits
New contracts in the quarter, not the whole stock; the colour on a building is the value of its area, not of the building.
Population change, year by year

The map of the 36 municipalities changes colour year by year, from 2016 to 2025, according to population change since 2015.

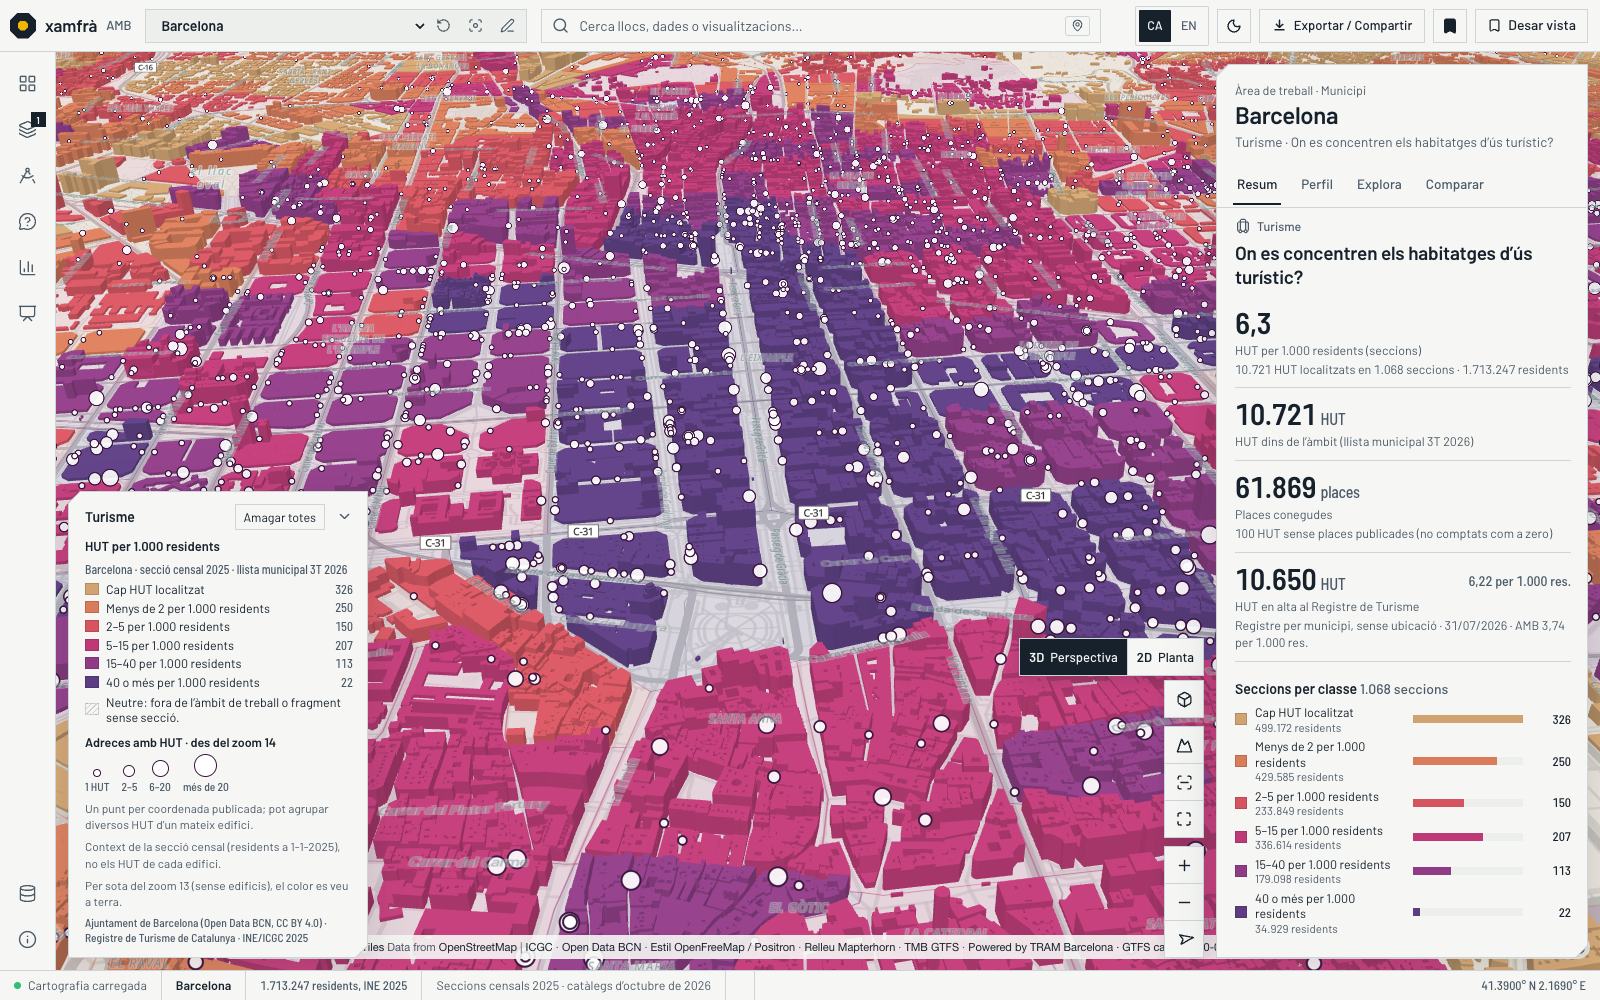
Tourism view in the Eixample: buildings coloured from pink to purple by the tourist-use dwelling rate of their section and white dots for each HUT address.
Tourist-use dwellings

Tourist-use dwellings per 1,000 residents in each section of Barcelona, with one dot per address. Section context, not those of each building.

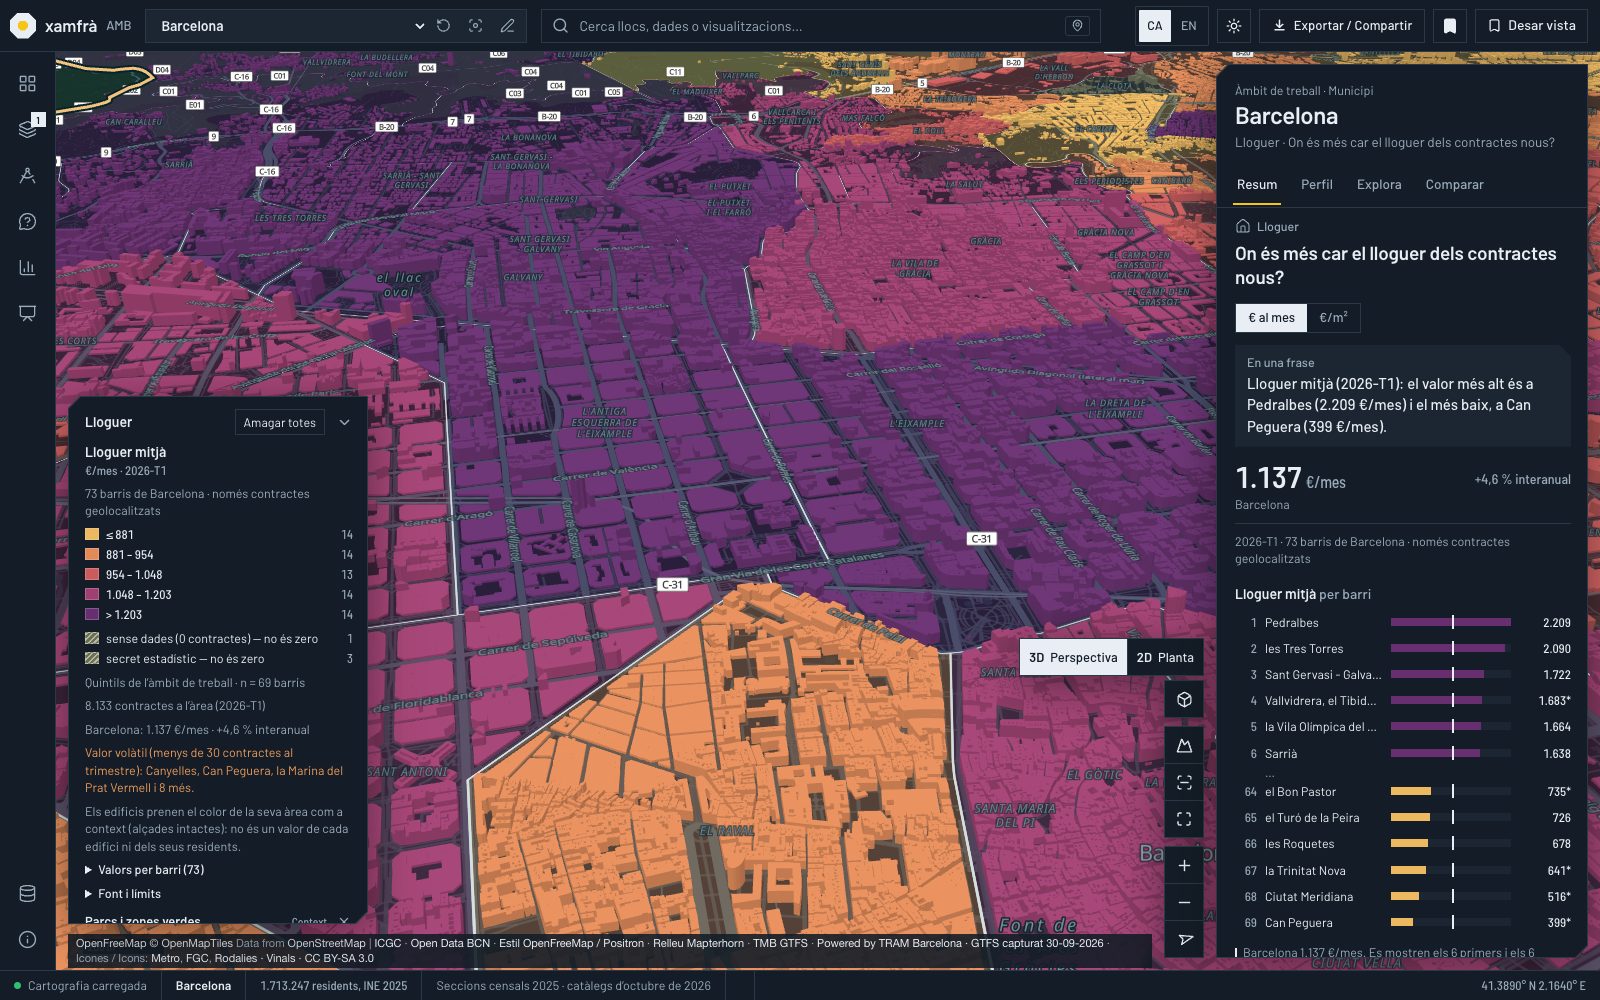
Rent view in dark theme: Barcelona neighbourhoods in purple and pink and the Raval in orange, with the legend and the neighbourhood ranking.
Rent

Average rent of new contracts by neighbourhood, 2026-Q1, in dark theme.

Case 6 · Commerce

Local commerce

For: economic promotion and commerce.

“Where are there most ground-floor premises without activity?”

What you see
The percentage of premises without activity, the density of active premises and the dominant sector by neighbourhood or district; the municipal markets; the business parks and registered unemployment by municipality.
Views and tools
Views › Empty premises, Commercial density, Retail mix, Markets, Business parks and Unemployment
Limits
Premises census of 2024, Barcelona only; “without activity” is the census classification, not today’s status.
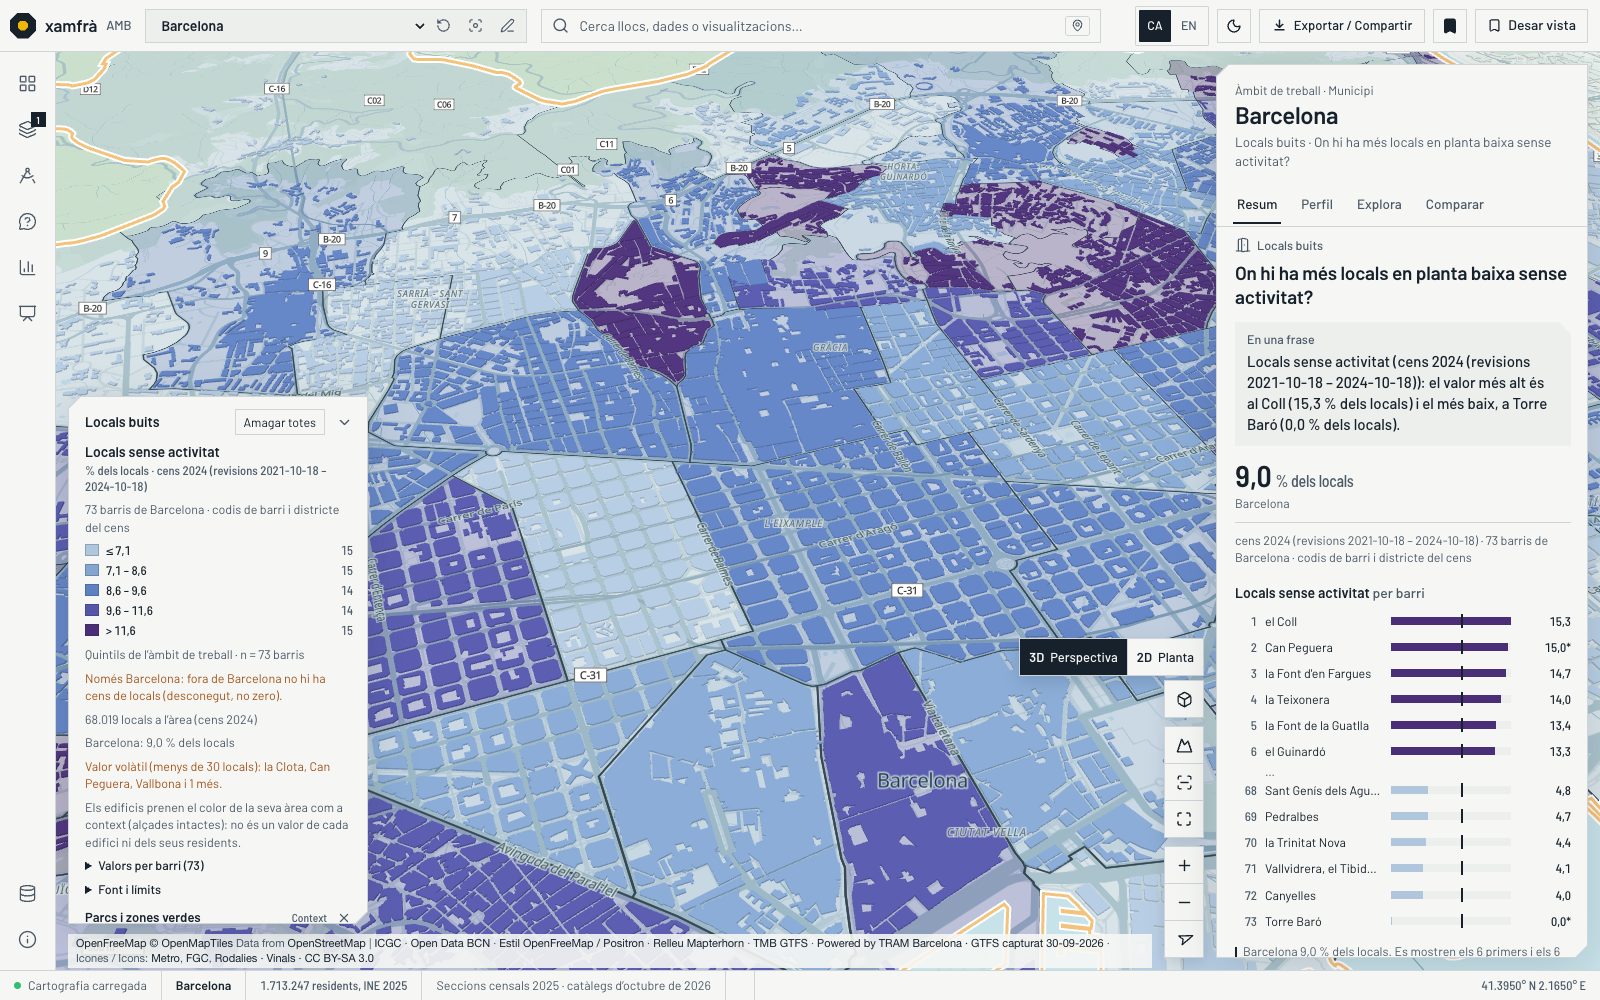
Empty Premises view: Barcelona neighbourhoods in blues and purples by the percentage of premises without activity, with the neighbourhood ranking in the panel.
Empty premises

Percentage of ground-floor premises without activity by neighbourhood (premises census 2024, Barcelona only).

Case 7 · Urban planning

Zoning, heights and massing

For: urban planning and municipal technical services.

“What zoning does each area have?”, “What was the land used for in 2016?” and “What changes if we raise this block?”

What you see
The zoning of the AMB consolidated text (1 January 2024) and the land use observed in 2016 in plan view and without buildings; heights; an illustrative massing proposal with the reference height plane and the densification simulator.
Views and tools
Views › Zoning, Land use and Heights · Planning › Massing proposal, Height reference plane and Densification simulator
Limits
Illustrative: not approved planning or any procedure. OpenStreetMap representation heights.
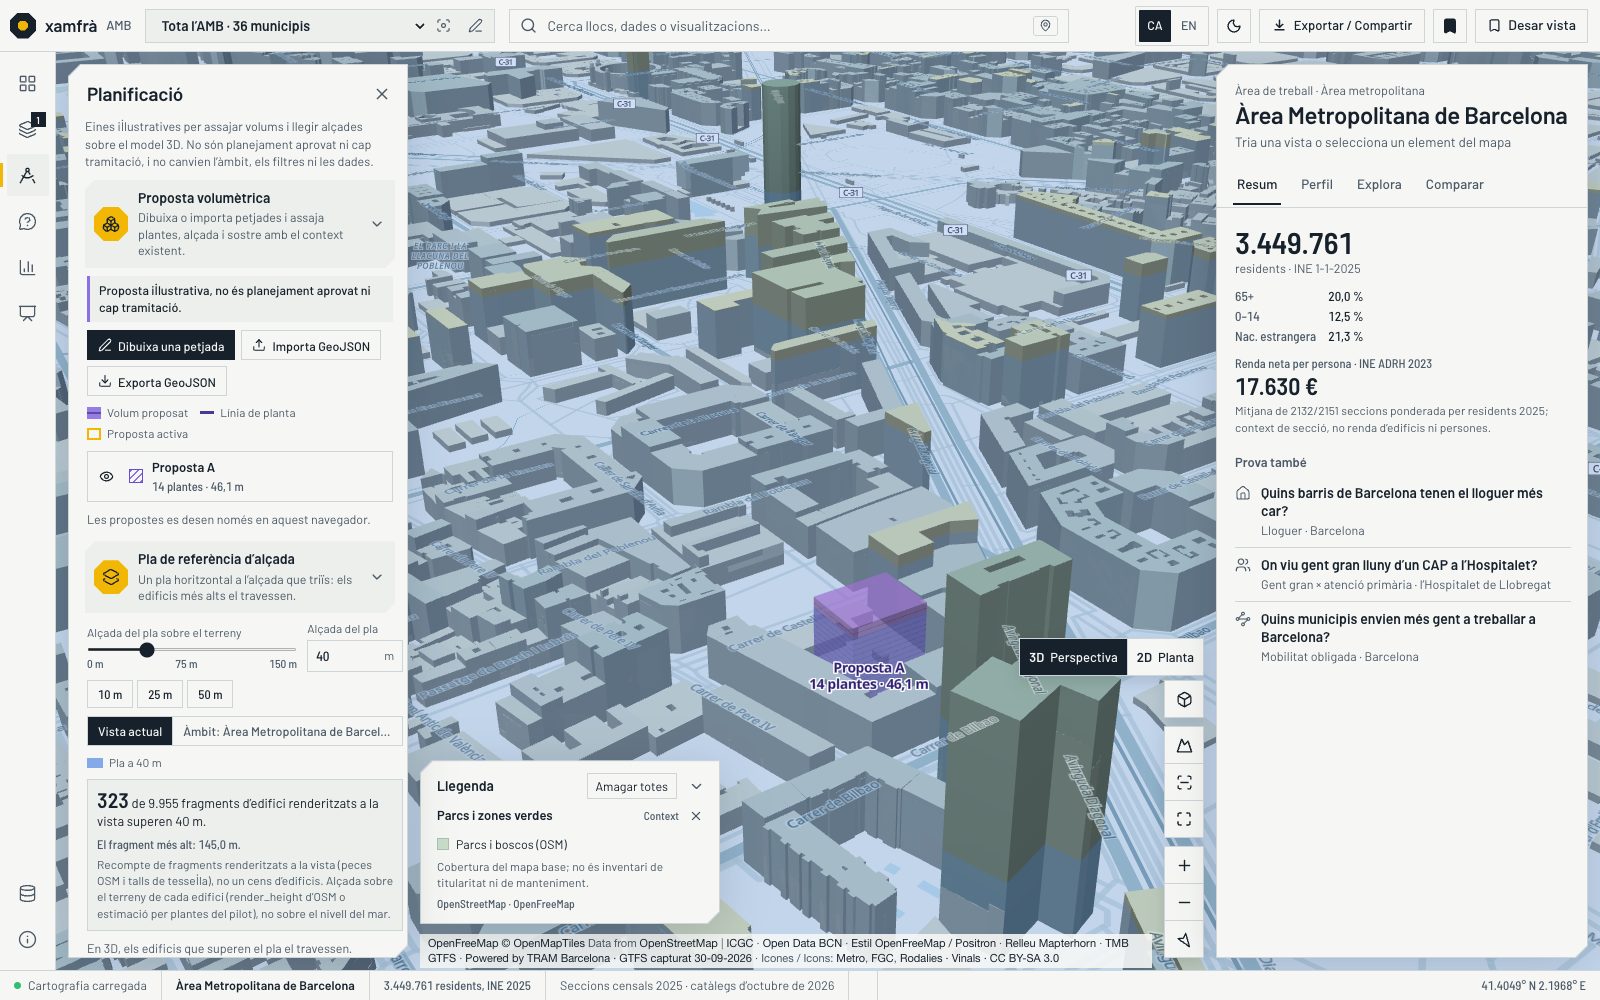
Planning tool in Poblenou: a 14-storey massing proposal in violet among the buildings and a translucent plane at 40 metres, with the proposal and plane panel on the left.
Massing proposal and height plane

An illustrative 14-storey proposal in Poblenou and a plane at 40 m that the towers cross; the panel reminds that it is not approved planning.

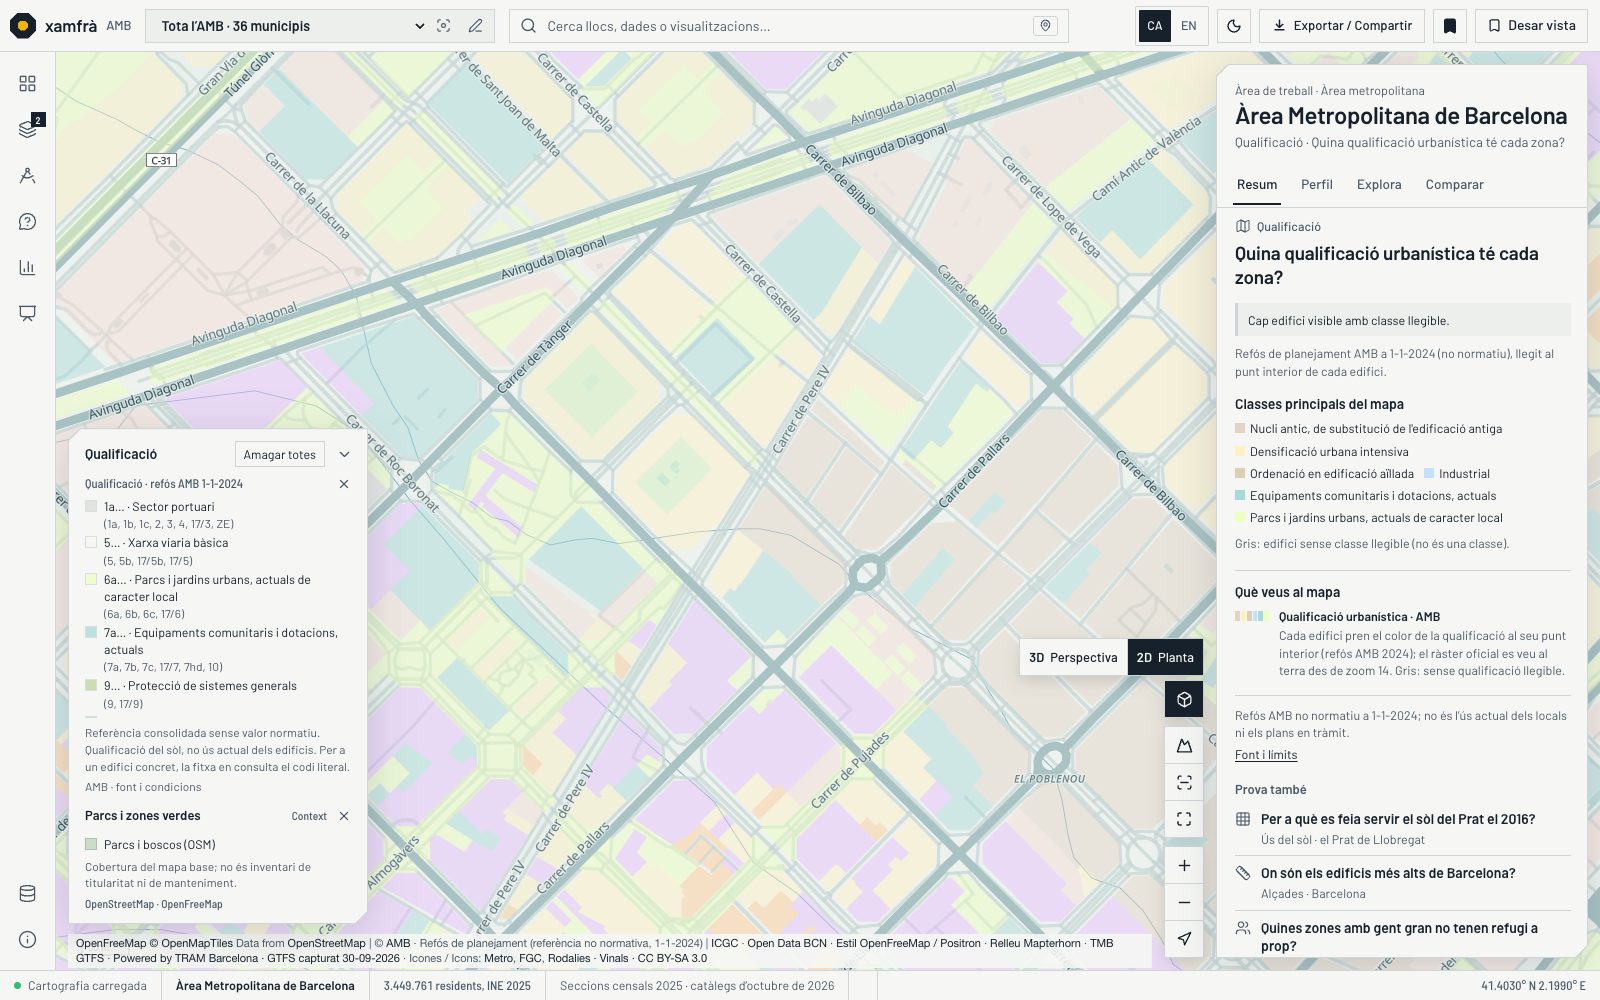
Zoning view in plan and without buildings in Poblenou: the consolidated-text zones in soft colours, with the Diagonal and the Meridiana and the legend on the left.
Zoning in plan view

The AMB planning consolidated text at 1 January 2024 on the ground, without buildings. Non-normative reference.

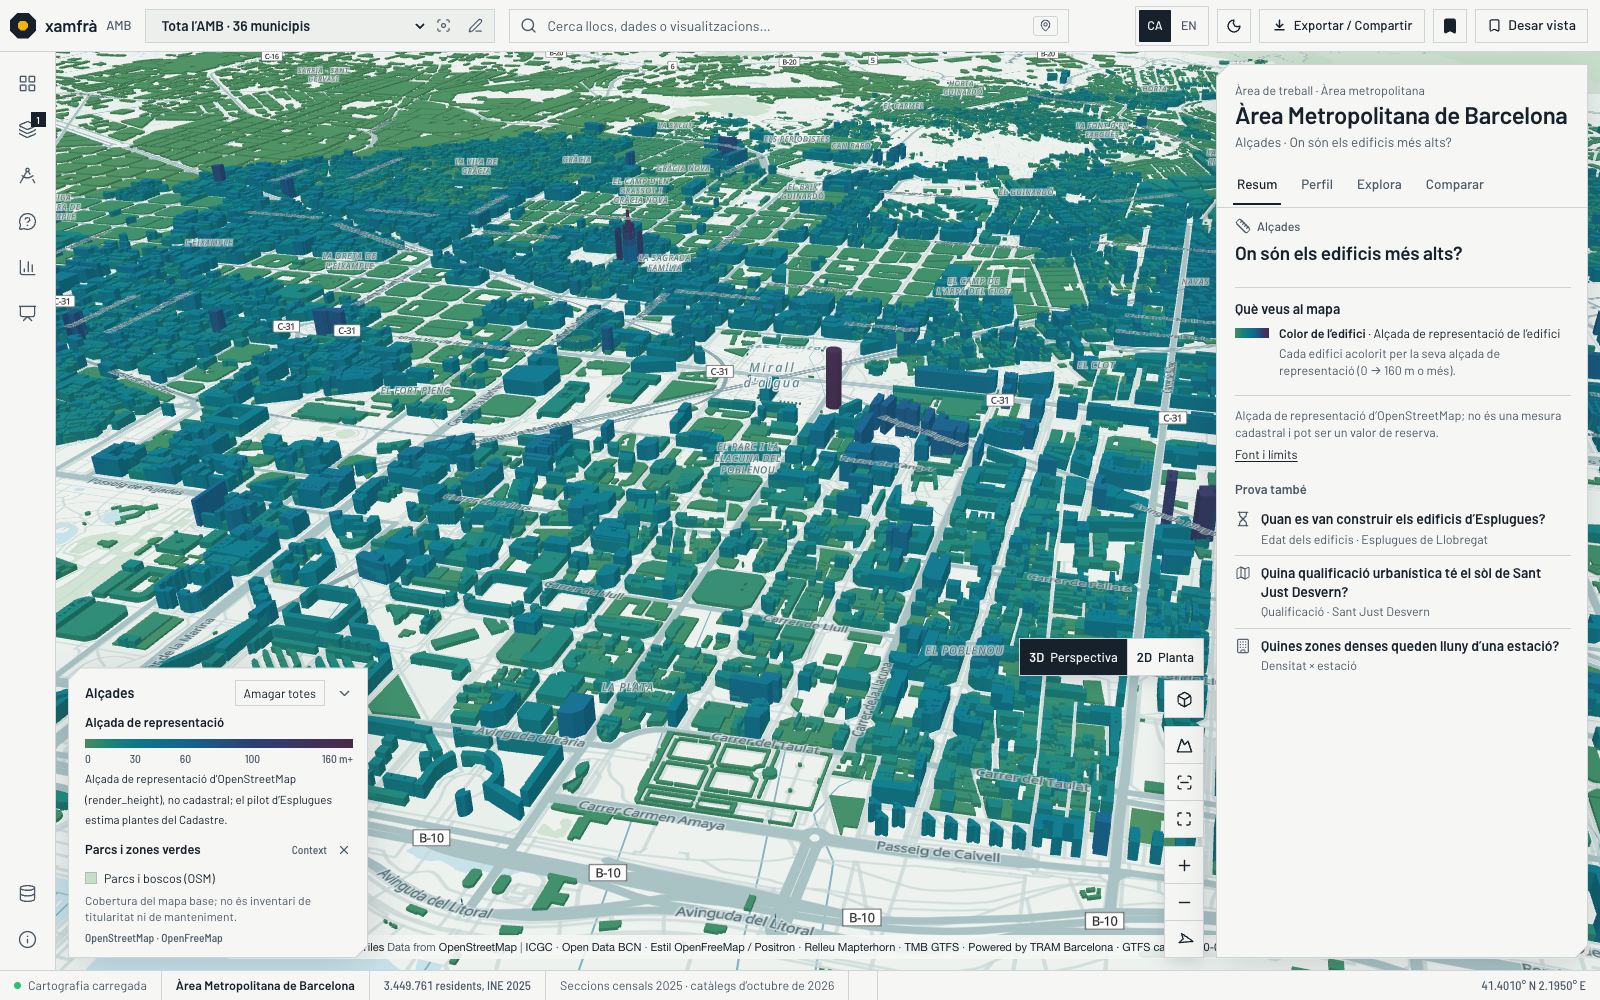
Heights view in Poblenou and 22@ with buildings coloured by height and the tallest towers highlighted.
Heights

Each building coloured by its OpenStreetMap representation height, from 0 to over 160 m. It is not a cadastral measurement.

Case 8 · Presenting

Explaining it to the council plenary

For: councillors’ offices, cabinets and technical teams who have to explain a decision.

“How do we explain to the plenary where the new facility is needed?”

What you see
Saved scenes (area, view and camera) presented full screen with their legend; the dark theme for projection rooms; the area card in PDF (A4) with sources and method; the view link and the PNG image with legend.
Views and tools
Presentation (scenes) · Export / Share · dark theme · area card
Limits
A scene saves the configuration, not the data: it is redrawn with the data of the moment it is presented.
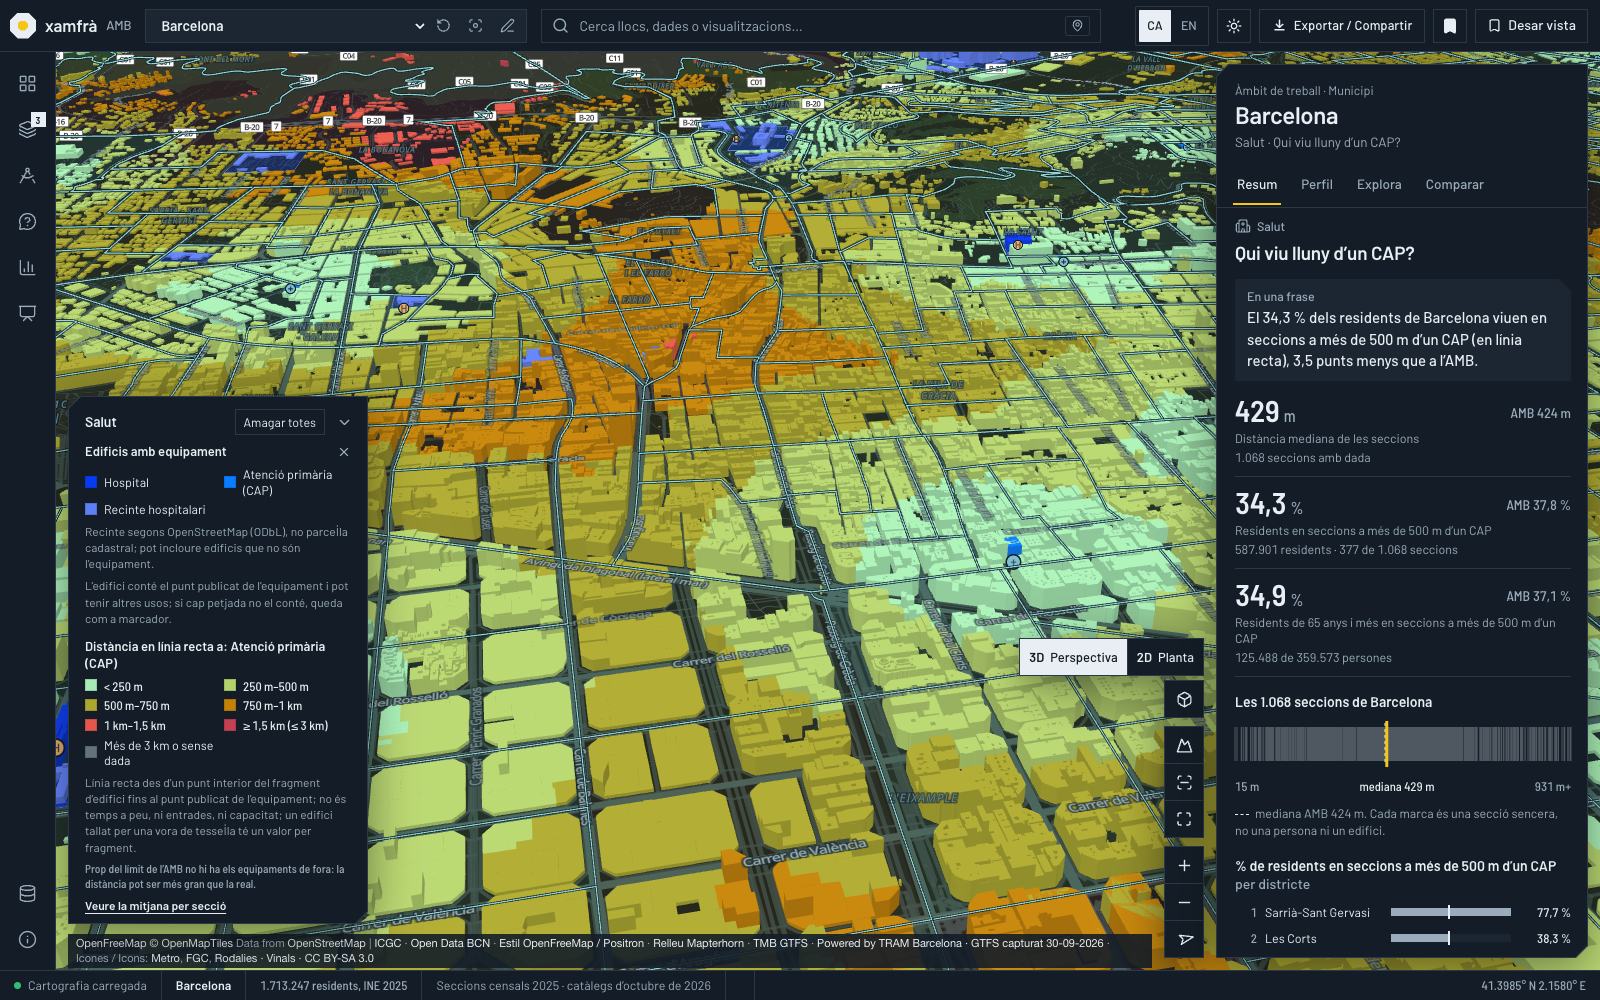
Health view in dark theme: Barcelona buildings coloured by distance to the CAP and the panel with the figures.
Health

The Health view in dark theme, for projection rooms.

Area card in PDFTwo overlapping A4 pages: the cover of the Barcelona card with three figures and a small map, and a page from the Services and proximity section with bars, a strip of sections and the sources at the foot; a PDF label and, beside it, what the card includes.2Services and proximityWho lives far from basic services?Sources: INE · GeneralitatXamfràArea cardMunicipalityBarcelona1,713,247residents, 202521.0%65 and over429 mmedian to the CAPHow to read itPDFA new tab, A4 size,to save as PDFKey figures, services, housing,mobility and environmentEach chart with the AMB referenceSources, dates and method at the endIn Catalan or English
Area card in PDF. Diagram, not a capture.

Is your question not here?

We prepare new views with your data and your questions, with the same method: source, year and limits on every colour. Let’s talk.