Xamfrà › Methods paper
Open methods to detect and appraise urban opportunities
A paper explaining how Xamfrà finds opportunities in the AMB and appraises them with counted, visible criteria instead of weighted indices, and which data, tests and limits stand behind each figure.
- 65activity poles59.5 % of activity on 9.7 % of the land
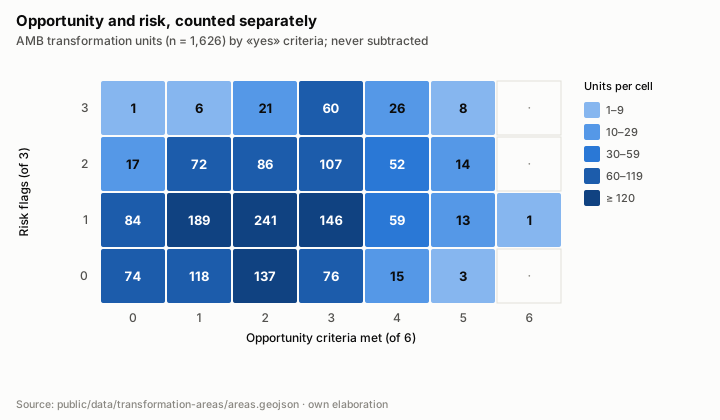
- 1,626transformation units191 with ≥ 4 opportunity criteria; 18 with no risk
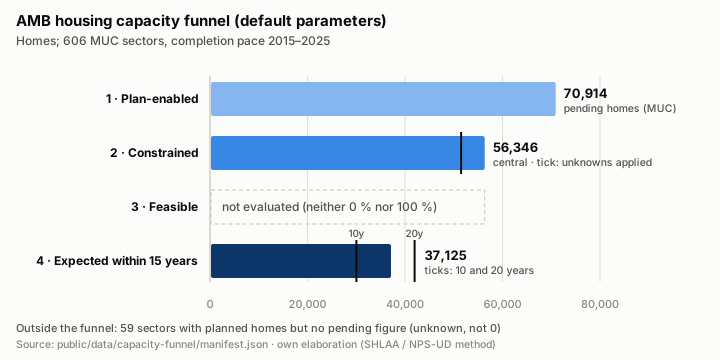
- 70,914plan-enabled homes37,125 expected within 15 years at the 2015–2025 pace
- 25 %of pending homes within a 600 m walk of a well-served stationagainst 60 % of today’s dwellings
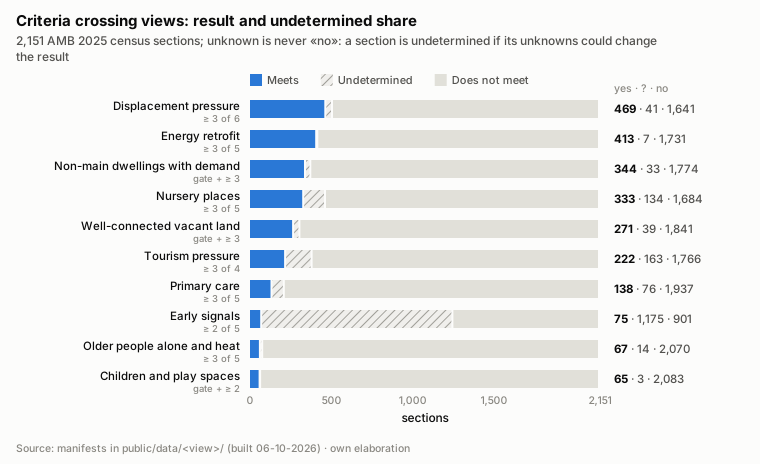
- 469sections under displacement pressure739,689 residents; ≥ 3 of 6 criteria
- 485,959jobs within 30 minfor the typical resident, by public transport (modelled)
Figures read from the public/data manifests (latest build 6 Oct 2026). Nothing on this page is official planning or a forecast.
Blanco Quintanilla, H. (2026). Xamfrà: open methods to detect and appraise urban opportunities. Methods paper, version 1.0. Xamfrà. https://xamfra.damosenelblanco.com/en/article-metodes
Four design rules
What makes the method different is not one dataset but how they are combined.
Counted, not weighted
Each criterion is yes, no or unknown with a visible threshold. Criteria are counted, never weighted, and risk is never subtracted from opportunity.
Unknown is not «no»
Missing data stay unknown with a reason. A section is undetermined when its unknowns could change the result.
Whole sections, colour as context
Population is assigned by whole census sections. A building’s colour is section context, not a fact about that building.
Provenance and sensitivity
Every dataset has a manifest with sources, dates, hashes and licences, and a sensitivity table for decisive thresholds.
Eleven method families
Each family adapts published international references to the AMB’s open data.
Centralities and activity poles
Getis-Ord Gi* hot spots on activity mass (Cadastre + OSM) on a 150 m grid; ingredients of the PDU’s new centralities.
References: Getis & Ord (1992); Katz & Wagner (2014)
Transformation areas and detector
1,626 units with opportunity and risk criteria counted separately; editable presets for planning questions.
References: OECD/JRC (2008); GLA
Housing capacity
Funnel plan-enabled → constrained → feasible → expected, with a back-test of the completion pace.
References: London SHLAA; New Zealand HBA
Job accessibility
RAPTOR on GTFS with 25 departures; cumulative and Hansen accessibility with β fitted to MITMA trips.
References: Delling et al. (2015); Hansen (1959)
Productive land
Industrial and logistics land demand 2035–2045 against supply with and without the PDU conversions.
References: GLA Industrial Land Demand (2017)
Impacts and safeguards
Displacement pressure, staged typology, service ratios, protected quota and the station-proximity rule.
References: Bates (2013); CEQR; SoBoN; Copenhagen
Value capture
Residual method in three scenarios and Catalan legal obligations; comparison with SoBoN.
References: RD 1492/2011; Law 11/2025
Ex-post evaluation
15 transformations since 2000 compared with their municipality on harmonised census units. Descriptive, not causal.
References: Angrist & Pischke (2009)
Legal and physical constraints
Heritage, aircraft noise, natural areas, contaminated soils, coast and power lines, as a screening.
References: Official open sources
Crossing views
Ten social and service questions per census section with the same three-valued counting rule.
References: Kleene (1952)
Economy
Location quotients, shift-share and municipal economic complexity with diversification candidates.
References: Dunn (1960); Tacchella et al. (2012)
Three figures from the paper
Generated from the published files; the paper has all eight.
What does not work well is published too
Back-test of the pace rule: horizon figures are orders of magnitude, not forecasts.
| Test | Predicted | Actual | Bias |
|---|---|---|---|
| 2005-2014 → 2015-2025 | 77,790 | 47,775 | +62.8 % |
| 2010-2014 → 2015-2025 | 35,435 | 47,775 | −25.8 % |
| 2015-2019 → 2020-2025 | 17,839 | 32,909 | −45.8 % |
| min(2020 potential, 2015-2019 pace × 6) → 2020-2025 | 17,542 | 32,909 | −46.7 % |
Limits
- No causal claims: ex-post comparisons are descriptive.
- No personal data; registers queried only as aggregates.
- Non-commercial licences flagged; commercial use of the Cadastre product pending review.
- PDU at initial approval; MUC sectors as of 02-2024.