The 179 municipalities on one sheet
How does each municipality compare with the other 178, on every indicator at once?
291 questions about the 179 municipalities of the region, answered on a 3D map with the source, year and limits of every figure. The same method as in Barcelona, with Madrid’s own sources.
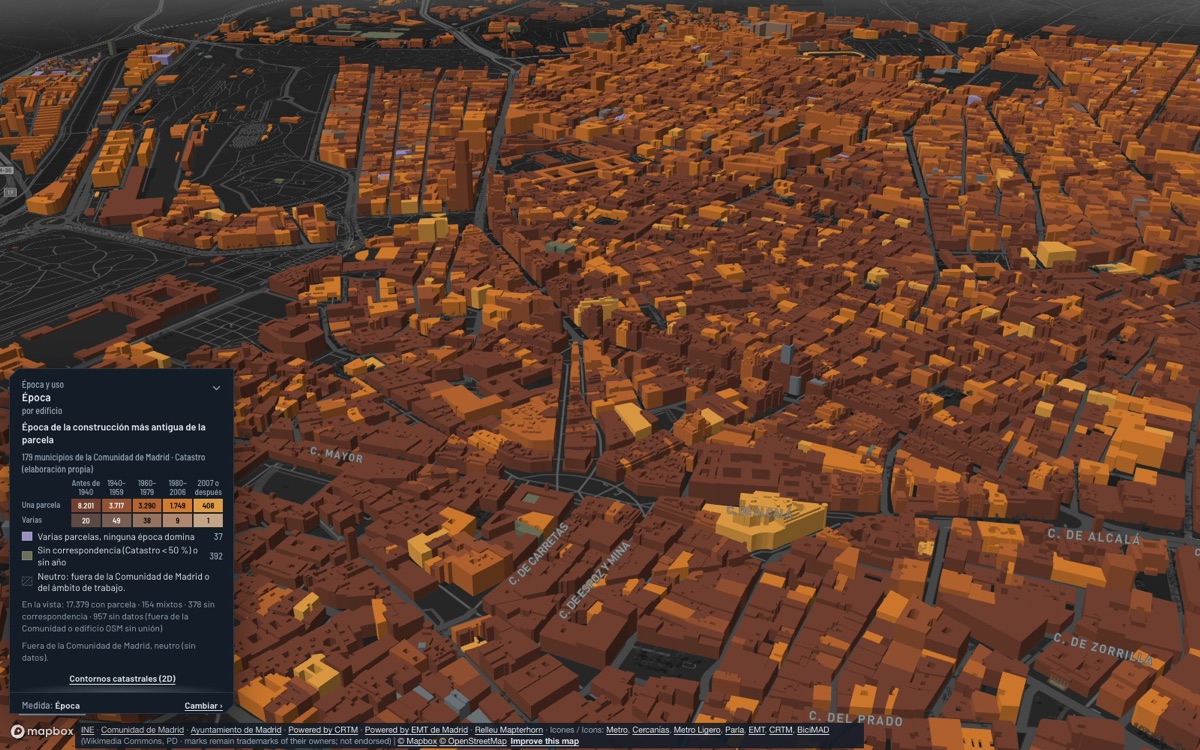
Each comes from a public source and leads to the view that paints it, building by building or section by section.
protected rental homes could come from offices under Law 3/2024, in the municipalities where the law applies.
Community of Madrid, Law 3/2024 layer
See the view: Offices to protected housing (Law 3/2024) →of the land that was vacant in 2016 is built on or in use by 2026: 15,288 of 37,045 hectares.
Community of Madrid, vacant land 2016 and 2026
See the view: Vacant land consumed 2016 → 2026 →of the 24,995 homes of the Social Housing Agency were handed over since 2010.
Community of Madrid, Social Housing Agency
See the view: Social Housing Agency dwellings →private betting shops are less than 100 m in a straight line from a school in the city of Madrid, and 180 less than 200 m.
Madrid City Council, premises census; regional school register
See the view: Gambling premises and schools →tourist flats in the regional register in the city of Madrid, each on its building.
Community of Madrid, tourist accommodation register
See the view: Tourist accommodation →was the warmest year at the Retiro since 1940: a 16.95 °C mean, against 12.67 °C in 1956.
AEMET, Madrid – Retiro station (NOAA GHCN-Daily)
See the view: Temperature since 1940 →Each question is answered by several views of the viewer. All of them paint the data on the buildings or the sections, with the legend and the source in the panel.
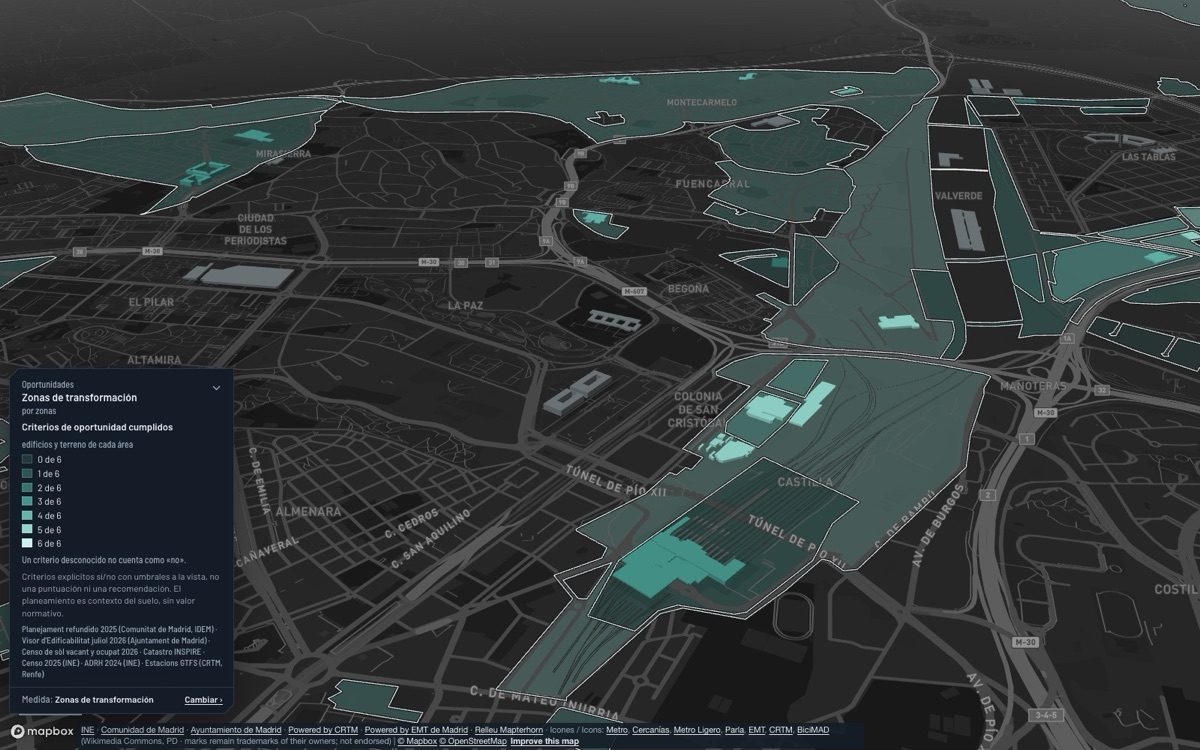
Planning and land
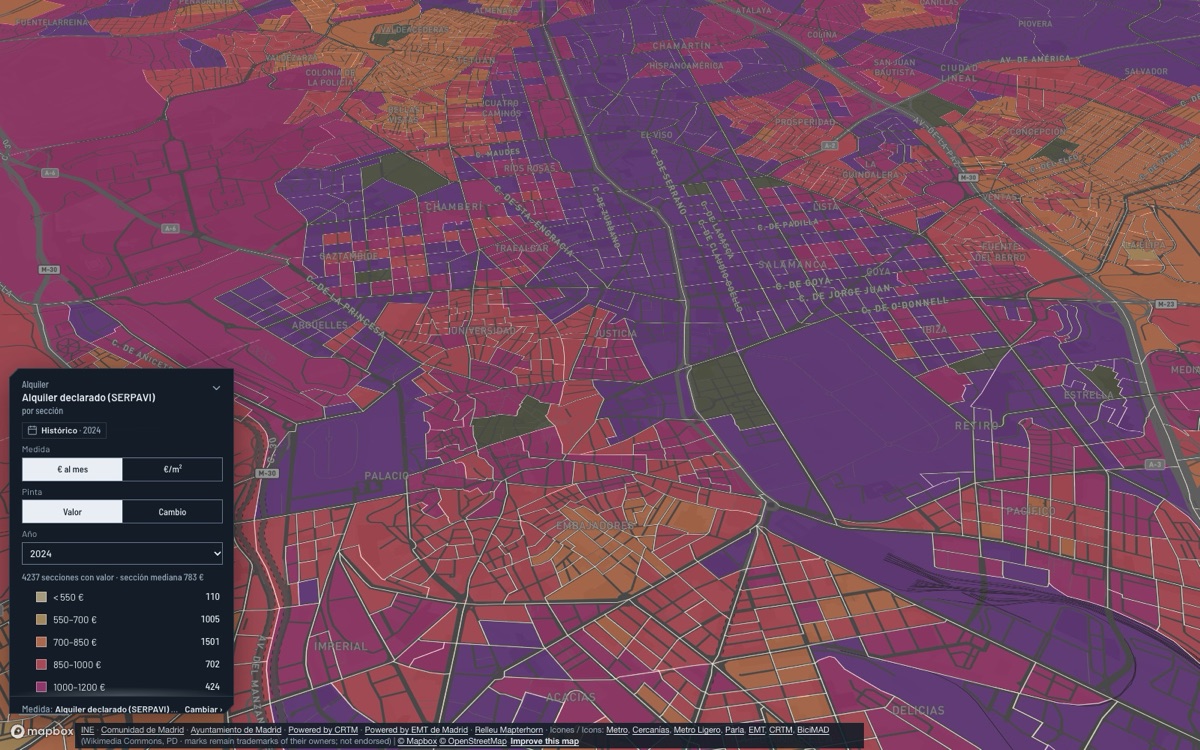
Housing
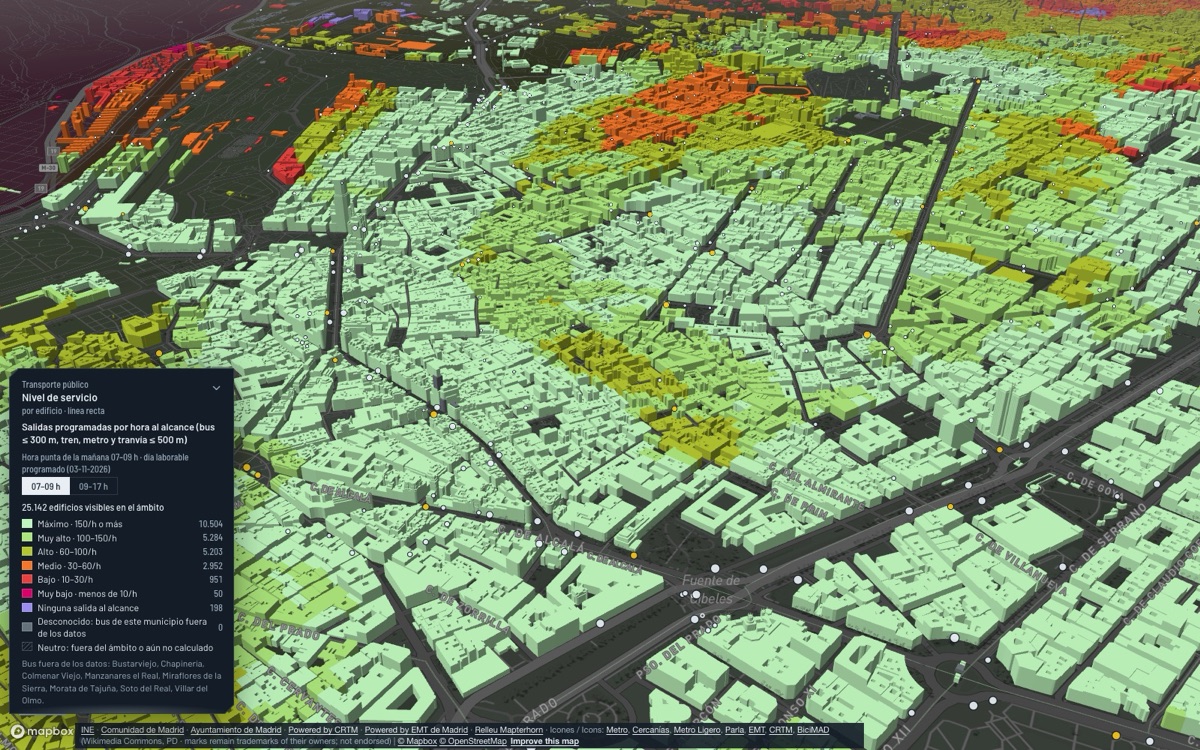
Mobility
Services
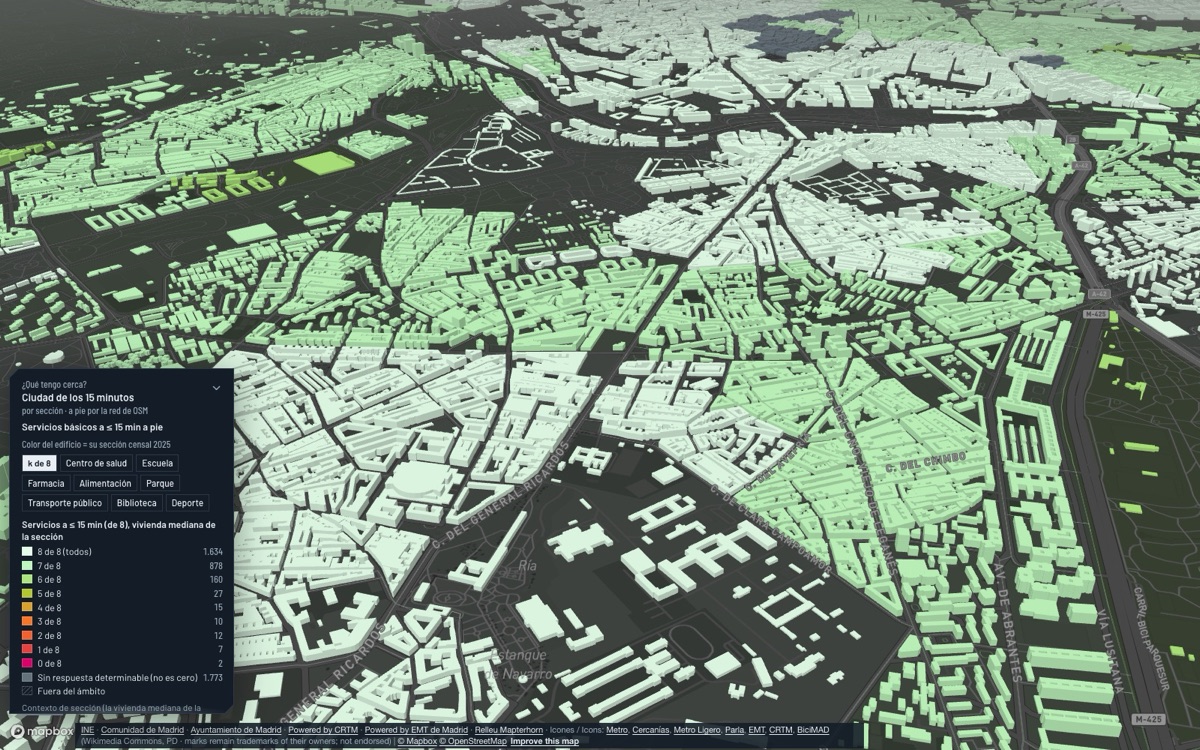
Climate and risk
Economy
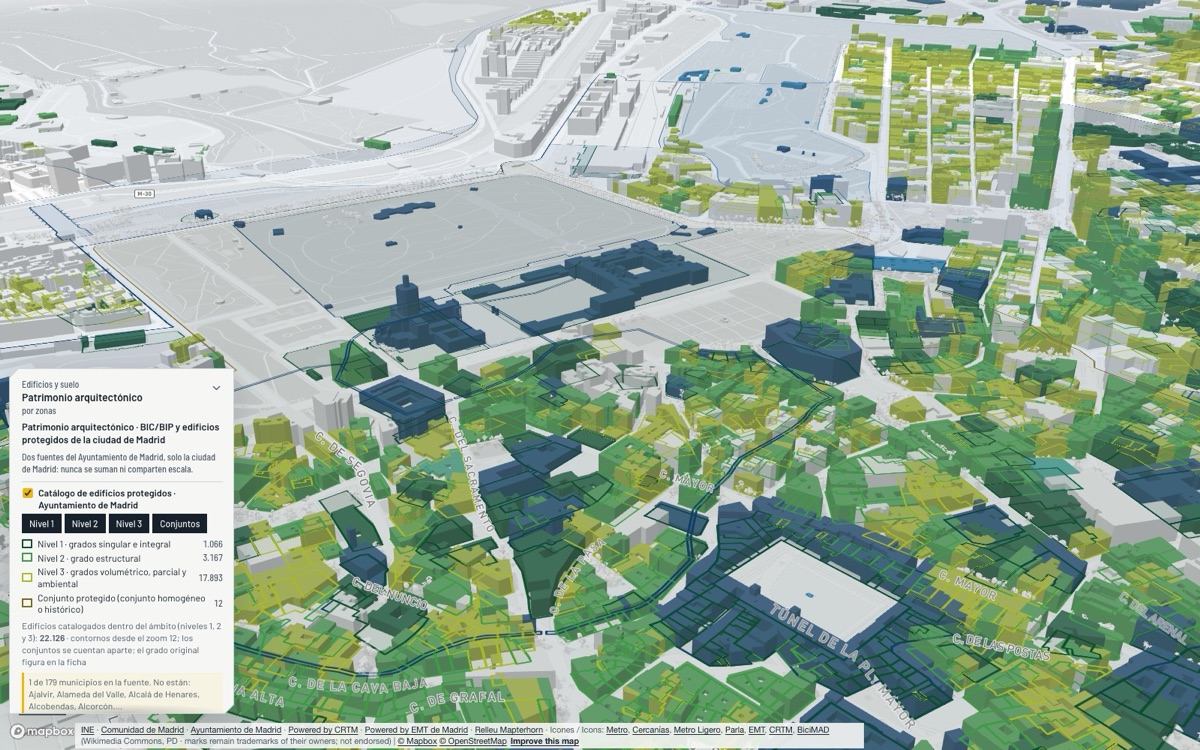
Buildings and heritage
It is not a copy of Barcelona. These views exist because Madrid publishes something of its own: the region’s municipal statistics, the 2024 law on turning offices into homes, the transport consortium’s mobility survey or the Retiro temperature series.
How does each municipality compare with the other 178, on every indicator at once?
How many offices could become protected rental housing under Law 3/2024 in each municipality, and where does the council apply it?
How many protected homes does the law require in each planning area?
How many dwellings of the Community’s Social Housing Agency are there in each municipality, and how many were handed over since 2010?
Where are registered tourist flats in residential buildings, and how many lie in the Centro Histórico where Plan Reside no longer admits new ones?
How do residents of the Community of Madrid travel depending on the transport zone they leave from: on foot, by public transport or by car, and how many trips does each zone generate and attract?
Where do BiciMAD stations lose and gain bikes in the morning and the evening, and how many trips does the system make a day?
Which vehicles pass the Fuenlabrada LEZ cameras, by environmental label, and at which entries?
How much has Madrid warmed since 1940?
What zoning does this area have in the Comunidad’s consolidated planning (in Madrid city, the City Council’s PGOUM 97; in Rivas-Vaciamadrid, the municipal PGOU), and how many hectares does each kind of land take?
Public bodies and open data, each with its own licence. In the viewer, every view says which source it uses, which year it is from and what it does not measure. Method and sources
Every view carries the source, the period and what the data does not measure, also when exported.
Many city council datasets cover only the city of Madrid. Outside it, the viewer says “no data”, never zero.
Views that combine data count how many conditions are met, with no hidden weights.
The full catalogue for the Community of Madrid, grouped in the viewer’s themes and families. Each view answers a single question.
28 views in 8 families
Where do older residents live?
Where do more people aged 80 and over live?
How many residence and day-centre places are there per 100 people aged 80+?
Which districts do the people on a municipal residence waiting list come from?
Where do most children live?
How far is the walk to a municipal play area?
How many people registered in each municipality in 2021 coming from another municipality of the Community, another region or abroad?
How do the people of each Madrid section change, month by month?
What age, how many older or young people and what pace of births and growth does each municipality of the Community have?
Where do most people live per km²?
How are the residents’ age and nationality spread?
How many dwellings are there per hectare and how does it compare with the rest of the Community of Madrid?
Where are there more one-person households?
At what density do the people of each municipality really live, and how far is it from the gross density usually quoted?
Which Madrid city sections have most people living alone, according to the 2025 register?
Which sections resemble each other?
Which barrios does the Ayuntamiento rank as most vulnerable?
Which sections does the Ministry classify as vulnerable, and why (studies, income, unemployment or housing)?
Where do more foreign-national residents live?
Where do more people born outside Spain live?
Do residents of foreign and Spanish nationality mix or separate in each municipality, and how far apart are the incomes of its sections?
Where do more people with tertiary education live?
Where do more people who did not go beyond primary education live?
What share of residents of working age work or look for a job?
What were the turnout and the most-voted candidature in each section at the Madrid Assembly elections?
Which city problem do residents of each Madrid district cite most?
Where are associations founded, and where not?
Views that answer a question of their own, with no family.
How does each municipality compare with the other 178, on every indicator at once?
30 views in 8 families
Where is the rent highest?
How much rent is paid in each section, as declared to the tax office, and how has it changed?
What share of a household’s income would the declared rent represent, in each section?
Where do enough conditions associated with residential displacement risk coincide?
Where is declared rent high while fewer jobs are within reach by public transport?
Where do vulnerable residents, good rail access and a shifting rent coincide?
What is housing worth according to the appraisals in each municipality, and how much has it risen over 5 and 10 years?
How many homes are bought before a notary in each municipality of the Comunidad de Madrid, and how has it changed over 5 and 10 years?
Where do noise, polluted air, heat and a lack of green pile up on the same people?
Where does buying to let yield most, and how has it changed?
Which sections rent below or above what jobs within reach, income and surroundings predict?
What share of dwellings is rented, owned or not a main residence, and how does it compare with the Community of Madrid?
Where are there most dwellings with no or very low electricity consumption?
Where are there many non-main dwellings in sections with much renting, rising rents, services and rail nearby?
How many homes will demographic turnover release in ten years, and how does that compare with the new homes planned?
What age, size, value and rent do the homes of each municipality have?
How many applications for rent aid are accepted per 1,000 households in each municipality?
How many launches do the courts of each judicial district execute per 1,000 households, and of which type?
How many dwellings of the Community’s Social Housing Agency are there in each municipality, and how many were handed over since 2010?
How many offices could become protected rental housing under Law 3/2024 in each municipality, and where does the council apply it?
Where are registered tourist-use dwellings (VUT) concentrated?
Where are registered tourist flats in residential buildings, and how many lie in the Centro Histórico where Plan Reside no longer admits new ones?
Where do registered tourist flats concentrate, and has rent risen more there than elsewhere?
Where do inefficient, old dwellings, low income and older residents with many one-person households coincide? (heat is not available in Madrid)
Which buildings are residential and predate 1980, and how many energy-poverty criteria does their section meet?
Does the building meet its own conditions that make it a place to look first for rehabilitation?
How many European retrofit grants and how many euros has Madrid city received per dwelling since 2022?
Where have building rehabilitation grants reached?
Views that answer a question of their own, with no family.
Who lives around the new stations, in sections with displacement conditions?
27 views in 6 families
How many basic services do residents have within a 15-minute walk?
Where are Madrid’s drinking fountains and public toilets, and which neighbourhoods have fewest per resident?
How many basic services are close to home?
Who lives far from a primary-care centre?
Who lives far from a pharmacy?
Who lives furthest from a hospital?
Where do a health centre serving many residents, an old population, low income, planned new residents and a centre more than a 1 km walk away coincide?
How many years can a newborn expect to live in the Community’s large municipalities, and what is the gap between women and men?
How many years of life separate two metro stops?
Who lives far from a primary school?
Where do many children aged 0–2 live without a public nursery within a 500 m walk, with low income and new homes planned nearby?
How much schooling is there in each municipality, what pupil-teacher ratio and what level of education do residents have?
Where are the facilities and services?
How many facilities are there per 10,000 residents?
Where are the municipal markets?
How much are the public libraries of each municipality used (visits, loans, users), and how many cinemas, museums and theatres are there per resident?
Where are the sports facilities?
Where are the libraries?
Which buildings and facilities does the Rivas-Vaciamadrid City Council have, and where are the fountains, play areas, municipal defibrillators and dog parks?
Which pharmacies, health centres, libraries, museums and theatres does each municipality have?
How many people have a recognised disability or receive social benefits in each municipality?
How far is the walk to a municipal social services centre?
Where are the mobile-phone antennas, which operators run them and which have 5G bands?
What exposure has been measured near mobile-phone antennas, compared with the legal limit?
What internet speed is measured in each neighbourhood, on fixed and mobile networks?
Which municipal sites in Madrid offer free WiFi?
What share of each municipality’s households lacks 5G at 3.5 GHz, fibre or a 1 Gbps connection?
54 views in 9 families
Where do residents work, and where do the people who work here live?
What share of each town’s employed residents works in Madrid city, and what share at home?
Is the metropolis a star around its capital or a network of cities?
How many trips are there between the municipalities of the Comunidad de Madrid on a weekday, at what time and for roughly what purpose?
At what time do people set off from each municipality, and when does scheduled public transport depart?
In which municipalities of the Comunidad de Madrid do trips from outside arrive, from which province and for what purpose?
Where do many residents study elsewhere, with few study places?
How many trips are there between the MITMA zones of the Comunidad de Madrid on a weekday, in which hour band and for roughly what purpose?
How do residents of the Community of Madrid travel between Madrid city and the tariff rings: on foot, by public transport or by private vehicle (2018 survey)?
How do residents of the Community of Madrid travel depending on the transport zone they leave from: on foot, by public transport or by car, and how many trips does each zone generate and attract?
Where do trains run most often?
Where do buses run most often?
How do you reach each station without a car, and what is missing?
Where do people change lines or modes, with how much service and for how many people?
How many passengers does each EMT bus line carry on a weekday, at what hours, and how much has that changed since 2019?
How many passengers does each public transport mode (Metro, EMT, interurban buses, Cercanías) carry, how have they recovered since the pandemic and what share does each have?
Which bus lines are there and where do they run?
Which stations and rail lines are there?
How does the City Council propose to reorganise the buses of Rivas-Vaciamadrid, and how does the Transport Consortium?
When does the next bus or metro call at each Rivas-Vaciamadrid stop, right now?
Who lives far from a train, metro or tram station?
How much scheduled public transport is there near each building (stops within 300 or 500 m in a straight line)?
Where is potential demand for public transport high and scheduled supply low?
How many (modelled) jobs can be reached by public transport and walking from each section in the morning peak?
Which sections combine a low income with poor public-transport access?
Where do many people travel but public transport is not a competitive alternative?
Where can you ride a bike?
Where are bikes or docks available now?
How many bikes (and vehicles) are actually counted on the street?
Where do BiciMAD stations lose and gain bikes in the morning and the evening, and how many trips does the system make a day?
Where are the BICINRIVAS stations, how many docks do they have, where does the segregated lane run and how much is the service used?
Where and why are drivers fined in Madrid, and how much does each camera report?
Where can you leave the car to take the train or the metro, how many places are there and which busy stations have none?
How many vehicles pass each Madrid measuring point on a weekday, and how much has that changed since 2019?
How many regulated parking places are there on Madrid’s streets, of which zone, and how have they changed since 2015?
Where is the queue longest for a municipal resident car park place?
Where are painted on-street parking bays, reduced-mobility bays and public car parks in Rivas-Vaciamadrid?
What lies inside the low emission zone and how many people live there?
How many cars and motorcycles are registered per 1,000 residents and how has the fleet changed since 2015?
In which barrios has the car fleet moved furthest to Zero and ECO labels?
How many public EV charging points does each municipality have per 1,000 dwellings?
Which vehicles pass the Fuenlabrada LEZ cameras, by environmental label, and at which entries?
Which streets of Rivas-Vaciamadrid close to traffic at school entry and exit times, and where is parking banned?
How many people are killed or seriously injured in road crashes per resident in each municipality?
Where do traffic accidents happen and which are serious?
Where are people hurt year after year, and on which street?
Where are there most and fewest municipal benches?
Which sections have the streets most people would pass through, given the shape of the network?
Which street fabric is a grid and which runs every way?
Where are Jane Jacobs’s conditions for lively streets met: people, mixed uses, small blocks, buildings of mixed ages, transit and nothing cutting the fabric?
Where is kerb space reserved for loading, and how many places?
Which business parks of the Comunidad de Madrid have area inside flood zones?
Where are fuel stations and what diesel price do they declare?
How many battery-electric vans are in the fleet of each municipality, and how many per 1,000 vans? (only municipalities of 10,000 inhabitants or more)
41 views in 8 families
Where is income higher or lower?
Where is income inequality highest?
Where do more residents live below the poverty-risk threshold?
Where does income rely most on pensions?
How much work income do the taxpayers living in each municipality declare on average in the IRPF?
Where has income per person grown most since 2015?
Which Community of Madrid municipalities grow, prosper and include everyone, and where does that fail?
Where are most people registered as unemployed?
Where has unemployment grown or fallen in a year?
Where is the share of the active population that is unemployed highest?
Which municipalities attract workers and which are mainly residential?
What share of initial hiring is indefinite?
Which towns have a sophisticated productive base, and which complex sectors are within their reach?
Do each town’s jobs grow with the cycle, because of its sectors, or through an edge of its own?
How many jobs, what output per resident, and what spending and debt do the council and economy of each municipality have?
Where are most ground-floor premises without activity?
Which Madrid neighbourhoods have the most active premises per km²?
Which Madrid streets concentrate the most open or closed premises?
Where have Madrid neighbourhoods gained or lost active premises since 2019?
What share of each neighbourhood’s active premises is retail?
Which street stretches work as a high street and which have the most closed premises?
Where are there many people for little supply of an activity, and which empty premises sit right there?
Where are Madrid’s shopping centres and large stores, and how many premises do they group?
What activities are in Madrid’s open premises, and where is each sector concentrated?
Where are the gambling premises in Madrid and how far are they from a school?
Where does each trade gather far more than expected, and which streets are «the street of»?
Where are the firms that deal in financial markets run from?
Where is nightlife in Madrid and does the Búho night bus reach the premises?
Where does the number of firms grow in the Comunidad de Madrid and which municipalities have a knowledge anchor?
Where are the most authorised terraces on public space?
Where are the business parks of the Comunidad de Madrid and how much of their land is occupied?
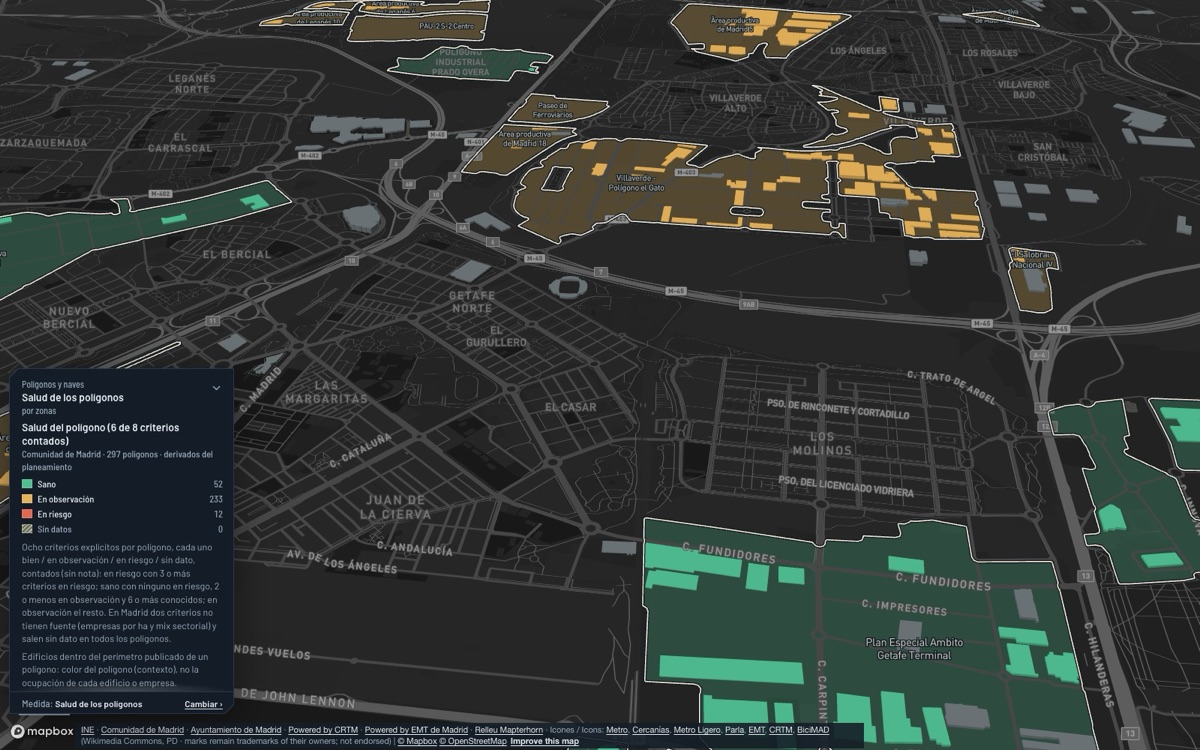
Which business parks meet more criteria at risk (occupancy, ageing, rail and metro, municipal industry, transformation, constraints)?
Where is aged activity land near a station already transforming, and where not yet?
Where are Madrid’s registered hotels and other tourist accommodation, and of what category?
How many tourists from elsewhere does each municipality receive, and in which month?
How much does each council spend and invest per resident, and on what?
How much do street lighting, cleaning, waste collection and parks cost per resident in each Community of Madrid council, and who runs them?
Where did the EU co-finance projects in the Comunidad de Madrid (ERDF 2014-2020), and of what kind?
How much works have Community of Madrid councils put out to tender in the months read from the Procurement Platform, and what does it amount to per resident?
Where are the public works tendered in 2024–2026, as their titles say?
What IBI rate does each municipality apply and what is the effective rate on the base, and how do they compare with the median?
31 views in 8 families
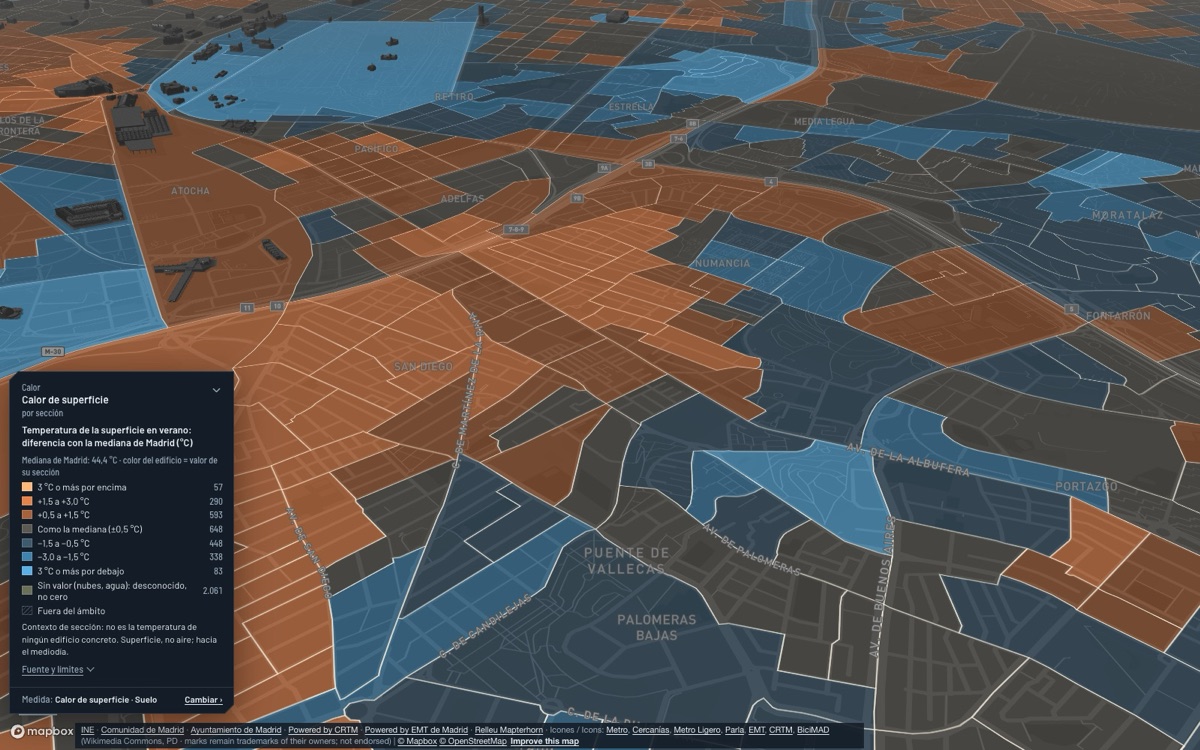
Which sections heat up most at the surface in summer, as seen from the satellite?
Who lives far from a climate shelter in Madrid city?
Where do many very old residents, often alone and on low incomes, live in hot sections far from a climate shelter?
Which bus stops are in the sun at 3 pm where it gets hot?
Where is the heat-island impact on thermal comfort highest, according to the City Council?
What kind of urban fabric (local climate zone) is in each place and how hot does it get in summer?
How much has Madrid warmed since 1940?
How much did it rain and how hot was it at each station of the Comunidad de Madrid, and where does it rank in its series?
Where are the parks, green areas and trees?
Who has no park nearby?
Which sections of Madrid, Fuenlabrada and Rivas-Vaciamadrid have more inventoried trees?
How much of each section is sealed, and where did it grow between 2021 and 2024?
How many species have been observed in each Madrid park, and which parks are little observed?
What share of the trees would fall to a pest or disease of a single species, a single genus or a single family?
How many people fall to each park, and how many square metres of park does each resident get?
Where do the green walking routes of Rivas-Vaciamadrid run and how long is each one?
How much of each municipality is protected space, Natura 2000, public forest or livestock route, and how much of the vacant land falls inside?
What air quality do the stations measure today?
Where is road-traffic noise highest according to Madrid’s strategic map?
How much night noise do Madrid’s fixed noise stations measure, and where?
Where do more NO₂ in the air and low incomes coincide?
How much lead, arsenic, nickel or benzene is measured in the air of the Comunidad de Madrid, compared with the regulation?
What annual mean has each station measured, and who would miss the 2030 limit?
How much photovoltaics does the Rivas-Vaciamadrid City Council have on its buildings, and how much of their use does self-consumption cover?
Where is there electricity grid capacity left to connect new demand or generation?
Where are Madrid’s recycling points?
Where do the urban treatment plants of the Comunidad de Madrid discharge, and how big are they?
How much electricity is used at each transformer centre of Rivas-Vaciamadrid, and which part is homes, services and industry?
How much electricity, gas and water does the Rivas-Vaciamadrid City Council use, in which facilities, and how has it changed since 2012?
How much water and electricity is billed per resident and how many recycling points does each municipality have?
How many kilos of glass are recovered per resident, and how many containers does each municipality have? (glass only, not all waste)
13 views in 5 families
What lies inside the official flood zones and how many people live in the affected sections?
Which floor would the water reach according to the official flood hazard map?
Which buildings with floors below ground lie inside a mapped flood zone (T500, T100 or T10)?
Where does water run: rivers, streams and canals, and which sections are buried?
Which built parcels of the Comunidad de Madrid are near mapped forest or scrub?
What is the fire-weather danger today and tomorrow in the forests of each municipality of the Comunidad de Madrid?
Which forest fires have there been in each municipality of the Comunidad de Madrid, and which burnt areas have been mapped?
What share of each municipality has a high or very high risk of wildfire, flooding, heat wave, industrial accident, landslide or collapse, among the Catalogue’s 47 hazards?
What risk does each census section face from a given hazard (wildfire, heat, flood, industrial accident, collapse…) according to the Community of Madrid Catalogue?
How far in a straight line is each building from the nearest registered defibrillator, and which areas are left far away?
How many interventions does the Madrid City Council fire service make per resident, and of what kind?
How many criminal offences does the police know of in each Community of Madrid municipality and how do they evolve?
How many incidents does Madrid’s Municipal Police handle in each barrio, and of what kind?
19 views in 8 families
When were the buildings built?
What are the buildings mostly used for?
What is the building stock used for and when was it built?
Where and when was today’s city built, and where has it been built in the last ten years?
Where are the tallest buildings?
Where are more certified dwellings rated E, F or G?
Where has the satellite flagged roofs with probable fibre-cement in Madrid?
Which municipal zoning and territorial radon potential are recorded?
Which buildings have passed the technical inspection (ITE)?
Which buildings in Madrid city are assets of cultural interest or protected by the planning catalogue, and at what level?
When were the streets named?
How many declared and incoated Assets of Cultural Interest (BIC) and Assets of Heritage Interest (BIP) does each municipality of the Community have, and of which categories?
What art is there in Madrid’s streets and squares, who owns it and in what condition?
Where are buildings being built, enlarged or refurbished?
Where is Madrid granting building licences, year after year, and does it match where income and rent rise?
Which parcels have vacant land according to the Comunidad de Madrid and how much land do they take?
Which crops did holders in the work area declare in the 2022 PAC?
How much of the land that was vacant in 2016 is occupied in 2026 in each municipality?
What was the land used for in 2014?
48 views in 7 families
What zoning does this area have in the Comunidad’s consolidated planning (in Madrid city, the City Council’s PGOUM 97; in Rivas-Vaciamadrid, the municipal PGOU), and how many hectares does each kind of land take?
What does planning allow around each station, and how much residential land do houses take compared with the homes they hold?
Where is there equipment land with no catalogued facility?
Which unexecuted facility reserves have no basic services nearby?
What is being built or planned, and at what stage?
Who will have a station within a 10-minute walk for the first time?
Which land is planned to grow or transform in the Comunidad de Madrid, which activity land could change, and with what risks?
Where is there vacant urban land close to rail, with daily services within walking distance, outside flood zones, where housing pressure is high?
Which station areas are well served but under-used, and where does planning already foresee growth?
Where are today’s centralities, where does planning foresee new ones and which have the ingredients to take hold?
Where is an area starting to change before statistics show it?
Where is buildable floor left on vacant plots in Madrid city, for what use and at what stage?
Which public land is for sale or concession today, for which use, and how much lies near a station?
Which transformations are under way in Madrid, and at what stage?
Where has most been built and demolished, according to the satellite?
Which buildings have fewer floors than their zoning allows?
Which buildings have more floors than their zoning would allow today?
How many protected homes does the law require in each planning area?
Where is there good rail or metro nearby but low housing density?
How many low buildings and vacant-land parcels lie within 500 or 800 m of each station?
Where does planning provide for homes where many are already not main homes?
Where will the coming public housing be built, and how many homes?
Which Madrid planning areas used up planned homes in 18 months, and were licences granted there?
How many empty premises would pass the tests to become homes, and how many already have?
Which station areas have both good service and room within 800 m?
Which parcels within 800 m of a station pass every filter, and how many homes could they hold?
In the new districts of south-east Madrid: how many homes are still to come, how many people live there and which services have arrived?
Since 1990, how many new homes were built within walking distance of a station, and how many far from one?
What were the surroundings of Madrid Nuevo Norte like before the works: rent, register and tourist flats within 1.5 km, against the rest of the city?
Where are the economic activity poles and what type are they?
When did the activity poles of the Comunidad de Madrid appear and how have they grown since 1965?
Where are the neighbourhood life centres, what do they lack and who has none within a 10-minute walk?
Where do dining, nightlife and culture concentrate, and what type is each pole?
Where are hospital beds concentrated, which poles are real health campuses and who has no hospital nearby?
How much economic-activity land would be converted and how much is gained in the Comunidad de Madrid, by municipality?
Where do jobs grow faster than employed residents, and how many jobs are there per home?
Which neighbourhood centres are also a job, evening, knowledge, health, transit and retail pole?
Does vacant activity land cover the growth of each municipality’s industrial and logistics jobs?
With the same method, how are Barcelona and Madrid alike and how do they differ?
What connects the campuses and research centres of the Community of Madrid with industry and the city around them?
Who produces scientific knowledge in the Community of Madrid, and with whom?
Which organisations run EU R&D&I projects, and who do they work with?
Which firms, universities and research centres share EU projects?
Where are the ingredients of an innovation district, and what is missing?
Which municipalities have knowledge jobs for the graduates who live there, and which are their dormitories?
How much public research and innovation money does each institution of the Comunidad de Madrid receive, and which funder does it depend on?
Where are the CSIC and IMDEA research institutes in the Community of Madrid?
Views that answer a question of their own, with no family.
Which offices could become homes under the new rules?
The viewer is in private beta. Request access and we’ll give you a login to try it on your municipality, district or area.