Xamfrà › Municipalities › Badalona
Badalona, in questions
9 figures for Badalona next to the AMB, each with its source, period and limits. Further down, the 36 questions the viewer can answer.
Figures next to the AMB
Each dot is one of the 36 municipalities; the dark mark is this municipality and the “AMB” line is the reference for the whole metropolitan area.
-
Residents
230,642
6.7% of the AMB
Rank 3 of 36 (highest first, logarithmic scale)
Source. INE, annual population census · Period: 1 January 2025
Limit. Resident persons; excludes visitors and floating population. The strip is logarithmic: Barcelona would make a linear one unreadable.
Open in the viewer → -
Population change
+7.4%AMB +7.9%
Rank 16 of 36 (highest first)
Source. Idescat, municipal register · Period: 1 January 2015 to 1 January 2025
Limit. The register, a different series from the annual census of residents. The AMB reference is derived: the sum of the 36 registers.
Open in the viewer → -
Aged 65 and over
19.9%AMB 20.0%
Rank 10 of 36 (highest first)
Source. INE, annual population census · Period: 1 January 2025
Limit. Share of residents; the whole municipality, with no differences between neighbourhoods.
Open in the viewer → -
Net income per person
€14,469AMB €17,634
Rank 31 of 36 (highest first)
Source. INE, Household Income Distribution Atlas (ADRH) · Period: 2023
Limit. Mean of the census sections weighted by 2025 residents, as in the viewer: INE’s municipal figure can differ by up to 5%. Not each household’s income.
Some section has no income value: it is left out of the mean and not counted as zero.
Open in the viewer → -
Rent of new contracts
€978AMB €1,071
Rank 10 of 36 (highest first)
Source. Incasòl, rent deposits · Period: first quarter of 2026
Limit. New contracts of the quarter, not the rental stock or what each household pays. The AMB reference is derived.
Open in the viewer → -
Registered unemployment
10.5%AMB 8.2%
Rank 3 of 36 (highest first)
Source. Generalitat, Observatori del Treball i Model Productiu (SEPE data) · Period: August 2026, provisional
Limit. Registered unemployment rate, not the Labour Force Survey; provisional. The AMB reference is derived.
Open in the viewer → -
Jobs per 100 employed residents
71AMB 124
73,005 affiliations located here and 102,560 held by residents
Rank 20 of 36 (highest first)
Source. Idescat, Social Security affiliations by workplace and by residence · Period: end of the second quarter of 2026, provisional
Limit. Affiliations, not persons; registered location of the contribution account, not where the work is physically done. Above 100, it attracts workers.
Open in the viewer → -
Residents more than 500 m from a CAP
24.9%AMB 37.3%
Rank 32 of 36 (highest first)
Source. CatSalut (health centre finder) and INE (2025 census) · Period: centres loaded on 4 Oct 2026; residents on 1 Jan 2025
Limit. Straight-line distance from one point of each census section, not walking time; a registered centre does not guarantee opening hours or capacity; centres outside the AMB are not included. Section value, not the building’s.
Open in the viewer → -
Residents without a 0.5 ha park within 300 m
42.2%AMB 33.7%
Rank 17 of 36 (highest first)
Source. OpenStreetMap (ODbL) and INE (2025 census) · Period: OSM of 29 Sep 2026; residents on 1 Jan 2025
Limit. Straight-line distance to a public park of 0.5 ha or more from one point of the section; OSM completeness varies and parks outside the AMB are not included. Section value, not the building’s.
Open in the viewer →
More context
Four readings that do not fit a dot strip, each with its own limit.
What people work in
Activity sections that weigh more in Badalona than across the municipalities with data by sector (end of June 2026).
| Sector | Jobs | Share here | Share in the AMB | Quotient |
|---|---|---|---|---|
| Construction | 8,515 | 11.7% | 4.8% | × 2.4 |
| Health and social work | 16,630 | 22.8% | 9.8% | × 2.3 |
| Wholesale and retail trade | 14,385 | 19.7% | 14.9% | × 1.3 |
Quotient: location quotient: the sector’s share in the municipality divided by its share across the municipalities with data by sector; above 1, more weight than the reference.
Source. Social Security affiliations by CCAE-2025 section, at the municipality of the contribution account (Idescat), end of June 2026, provisional.
Limit. Affiliations, not persons; rounded to multiples of 5. A cell under 50 affiliations has no quotient. Not an economic-complexity or cluster index.
Open in the viewer →Movement by mobile phone
Estimated trips of a working day, over 500 m, that start in Badalona.
- ≈ 3.2trips per resident that start here
- ≈ 406,200trips that start and end in the municipality
AMB: ≈ 3.6 trips per resident
Source. MITMA, mobility studies with big data (mobile phones) · Period: working week 13–17 October 2025
Limit. Estimate from mobile devices, not persons; no transport mode or route. Only trips over 500 m: in a small municipality most internal movement does not appear. Pairs under 10 trips a day are not published, so trips towards other places are a minimum. Residents of the MITMA zone, not the INE census; the AMB reference is derived.
Open in the viewer →What the sections are like
The census sections of Badalona split into five descriptive types, by the residents who live in them.
- A · Dense fabric, many children, low income, large households40.8% · 58 sections · 94,202 residents
- B · Medium density, older population, medium income23.2% · 38 sections · 53,438 residents
- C · Medium density, few children, high income, mostly built before 19609.7% · 16 sections · 22,366 residents
- D · Low-density fabric, many children, medium income, mostly built since 198017.8% · 26 sections · 41,041 residents
- E · Dispersed fabric, many children, medium income, far from primary care6.9% · 9 sections · 15,975 residents
- No type (data missing): 2 sections · 3,620 residents
Source. Xamfrà’s own method, k-means with five types, on INE data (2025 census, 2023 income), the Cadastre and service registers. Residents per 2025 section (INE). Generated on 6 Oct 2026 (method 1.0.0).
Limit. Descriptive grouping of the AMB’s sections on ten published variables: not a ranking or a score, and no type is better than another. Section context, not the building or the people. The A–E order is not a hierarchy.
Open in the viewer →EU-funded research
Horizon Europe (2021–2027) and Horizon 2020 (2014–2020) projects with participants in Badalona.
- 107participations
- 100projects
- 21organisations
AMB: 7,006 participations · 4,981 projects · 788 organisations
Source. CORDIS, European Commission; aggregated by Xamfrà. Data downloaded on 4 Oct 2026.
Limit. Only Horizon Europe and Horizon 2020 projects: not all research, nor private R&D, nor patents. A participation is one organisation in one project.
Open in the viewer →Questions the viewer answers about Badalona
36 questions with data for Badalona. Each link opens the viewer with the municipality already chosen and the question’s view. The viewer is in beta and asks for access.
Population
- What is Badalona like?Area profile in the right panel: residents, ages, income and services, with a reference to compare.Limit: A catalogue reading, not a diagnosis: a record is not capacity.
- Where do older residents live in Badalona?% aged 65+ of each census section on the buildings; CAPs, pharmacies and shelters highlighted.Limit: Whole-section value (INE 2025), not the residents of each building.View: Older people
- Where do most children live in Badalona?% aged 0–14 of each census section; schools, nurseries and libraries highlighted.Limit: Section context (INE 2025), not the children in each building.View: Children
- How has the population of Badalona changed since 2015?Register change 2015–2025 of the area next to the others (blue falls, red grows).Limit: Register on 1 January (INE by municipality; City Council for Barcelona); not the census behind the sections.View: Population change
Services
- Who lives far from a primary-care centre in Badalona?Each building with its distance to the nearest CAP or local clinic; the panel counts residents in sections more than 500 m from a CAP.Limit: Straight line, not walking time; a registered CAP says nothing about capacity.View: Health
- Who lives far from a primary school in Badalona?Each building with its distance to the nearest primary school; the panel counts residents in sections more than 500 m from a primary school.Limit: Catalogued centres with primary education, no places or school zones; straight line.View: Education
- Where are the social service centres in Badalona?Buildings containing a social service centre, highlighted on a neutral city.Limit: RESES registered addresses; they may not be the current premises.View: Social services
Mobility
- How much public transport is there near each building in Badalona?Scheduled departures per hour within reach of each building (bus within 300 m; train, metro and tram within 500 m).Limit: Scheduled weekday supply, not passengers or delays; straight line, not the walking route.View: Transit service level
- Who lives far from a train, metro or tram station in Badalona?Each building with its distance to the nearest train, metro or tram station; the panel counts residents in sections more than 500 m from a station.Limit: Station centre (GTFS), not entrances or service; straight line.View: Stations nearby
- Where do the residents of Badalona work?Inbound and outbound arcs of the municipality and a ranking of where its residents work.Limit: Persons with a registered workplace (INE census 2023), not trips or transport mode.View: Commuting
Housing and economy
- How much is rent in Badalona?Mean rent of new contracts in the latest quarter, next to the others.Limit: Incasòl deposits: new contracts, not the whole stock or what each household pays.View: Rent
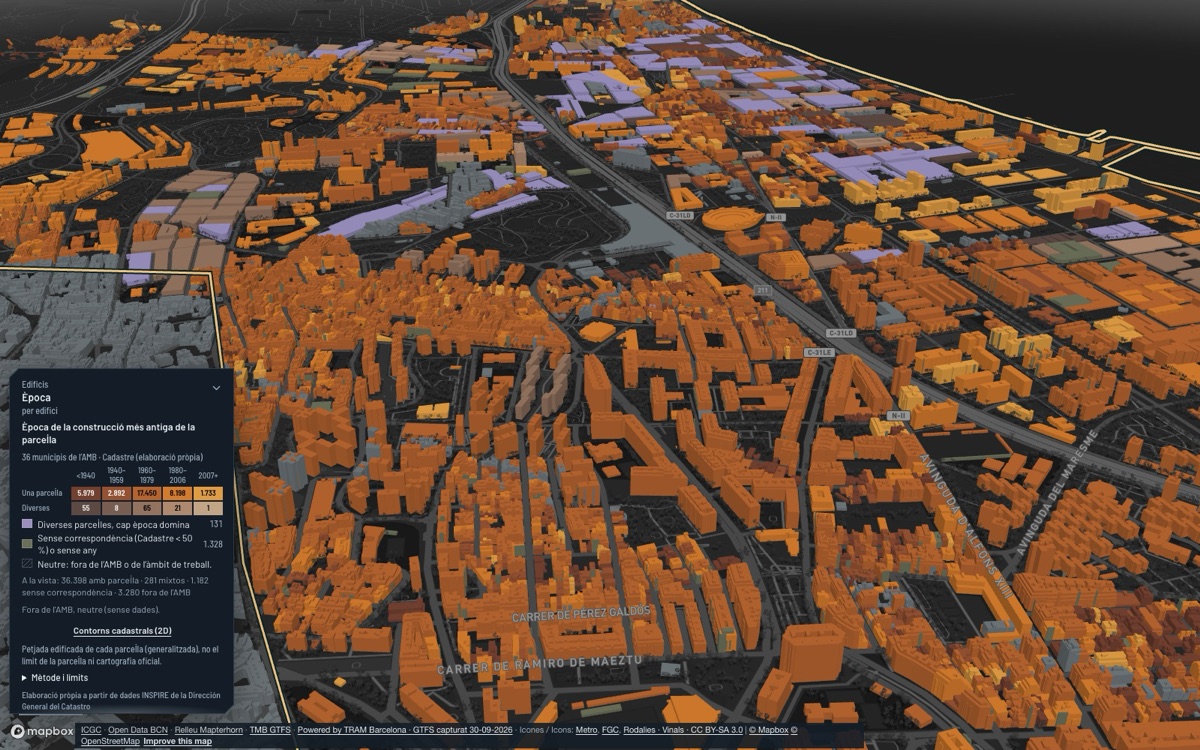
- When were the buildings in Badalona built?Each building with the period of its cadastral parcel’s oldest construction.Limit: Cadastre (own processing); parcel year, not verified building by building.View: Building age
- What is the registered unemployment rate in Badalona?Registered unemployment rate of the latest published month, by municipality.Limit: Provisional Generalitat rate, not the Labour Force Survey; no districts or neighbourhoods.View: Unemployment
Environment
- Who has no park nearby in Badalona?Each building with its distance to the nearest public park ≥ 0.5 ha; the panel counts residents with no park within 300 m.Limit: OpenStreetMap parks; straight line to the edge, not walking time or park quality.View: Park nearby
- Which part of Badalona is noisiest?Buildings tinted by the share of their section’s area at Lden ≥ 65 dB(A); night level on the ground.Limit: Strategic noise-map model, not exposed residents or a measurement.View: Noise
- Who lives far from a climate shelter in Badalona?Each building with its distance to the nearest climate shelter; the panel counts residents in sections more than 500 m from a climate shelter.Limit: A registered shelter does not guarantee opening hours or capacity; straight line, not walking time.View: Climate shelters
More questions (20)
Population
- Where do most people live per km² in Badalona?Residents per km² of each census section, on the buildings.Limit: Area of the whole section, parks and streets included; not each building’s population.View: Density
- Where do most foreign-national residents live in Badalona?% of foreign-national residents of each census section, on the buildings.Limit: Nationality (INE 2025), not place of birth; a section value, not the building’s.View: Foreign nationality
Services
- Who lives far from a pharmacy in Badalona?Each building with its distance to the nearest pharmacy; the panel counts residents in sections more than 500 m from a pharmacy.Limit: Authorised pharmacies; straight line, not walking time or on-call hours.View: Pharmacies
- Which facilities are there in Badalona?Neutral city; each building containing a facility takes the colour of its type.Limit: A highlighted building contains a facility point; outside Barcelona, social services have partial coverage.View: Facilities
- Where are the libraries in Badalona?Neutral city; buildings containing a library in colour, plus the points.Limit: Catalogued libraries; not opening hours, collections or loans.View: Libraries
- Where are the sports facilities in Badalona?Neutral city; buildings containing a sports facility in colour.Limit: Facilities catalogue; a record is not a single venue or capacity.View: Sport
- Who lives furthest from a hospital in Badalona?Distance to the nearest hospital; the panel counts residents in sections more than 3 km from a hospital.Limit: CatSalut registry hospitals; straight line, not ambulance time or speciality.View: Hospitals
- Where do older residents live far from a primary-care centre in Badalona?Bivariate map by section: % aged 65+ × distance to the nearest CAP or local clinic.Limit: Straight line from one point of the section, not walking time; a registered CAP says nothing about capacity.View: Older people × primary care
- Where do many children live far from a primary school in Badalona?Bivariate map by section: % aged 0–14 × distance to the nearest primary school.Limit: Catalogued centres with primary education, no places or school zones; straight line.View: Children × school
Mobility
- Where do buses run most often in Badalona?Streets coloured by scheduled bus trips per hour (TMB and AMB) and stops; a control steps through the day.Limit: TMB and AMB scheduled weekday supply, not passengers or live positions.View: Bus frequency
- Where can you ride a bike in Badalona?Bike lanes by type and shared ways, with the kilometres inside the area.Limit: Open sources per municipality; lower bounds where the network is incomplete; not bike traffic.View: Cycle network
- How often do trains call at the stations in Badalona?Scheduled trains per hour on metro, FGC, Rodalies and TRAM lines and stations; time-band selector.Limit: Scheduled weekday timetable, not observed trains or passengers.View: Rail frequency
Housing and economy
- Where is income higher or lower in Badalona?Net income per person (2023) of each census section, on the buildings.Limit: INE ADRH 2023 joined to 2025 sections; section context, not household income.View: Income
- How many tourist flats are there in Badalona?Tourist-use dwellings in the Tourism Register per 1,000 residents of the municipality.Limit: Registered tourist flats, not occupancy or listings; a section or municipal colour, not each building’s.View: Tourist flats
- How many jobs are there in Badalona per 100 employed residents?Jobs (affiliations) per 100 employed residents, by municipality; above 100, it attracts workers.Limit: Idescat affiliations at the municipality of the contribution account; no districts or neighbourhoods.View: Jobs
- Where are the business parks in Badalona, and how occupied are they?SIPAE business parks with the buildings inside tinted by declared occupancy.Limit: Figures declared by each municipality, each with its own year; not today’s activity.View: Business parks
- Where are the municipal markets in Badalona?Buildings containing a municipal market, highlighted on a neutral city.Limit: Known markets (official directories, placed with OpenStreetMap or CartoCiudad), not an exhaustive inventory; not opening hours or stalls.View: Markets
- Where are the tallest buildings in Badalona?Each building coloured by its display height, from 0 to 160 m or more.Limit: OpenStreetMap height, not a cadastral measurement; it may be a fallback value.View: Heights
- What is the approved zoning in Badalona?Each building takes the colour of the AMB 2024 consolidated zoning at its interior point.Limit: Non-normative consolidation as of 1 Jan 2024; not current use or plans in progress.View: Zoning
Environment
- What was land in Badalona used for in 2016?Land use observed in 2016 on each building, with the AMB raster on the ground.Limit: 2016 photo-interpretation: not zoning or today’s use.View: Land use
How we check
Every figure on this page comes from an open source with its publisher, period and licence. An unknown value is never painted as zero: when there is no data, the row does not appear. Method and sources →
Sources of this page
- INE: annual population census at 1 Jan 2025 and Household Income Distribution Atlas 2023 (CC BY 4.0).
- Idescat: municipal register 2015 and 2025; Social Security affiliations by municipality (tables by workplace and by residence).
- Generalitat de Catalunya: Incasòl rent deposits 2026-Q1 and registered unemployment rate of August 2026 (Observatori del Treball i Model Productiu, SEPE data, provisional); CatSalut, health centre finder.
- OpenStreetMap contributors (ODbL): parks, with the limits of their tagging.
- MITMA: mobility studies with big data, based on open data of the Ministry of Transport and Sustainable Mobility.
- CORDIS, European Commission: Horizon Europe and Horizon 2020 projects (Commission reuse notice); aggregated by Xamfrà.
Page generated on 17 Oct 2026 from the viewer’s published data.
Want to see Badalona in the viewer?
The Xamfrà viewer is in beta and asks for access. Tell us which municipality and which question you have and we will open it for you.